Investtech’s Analysis Concept
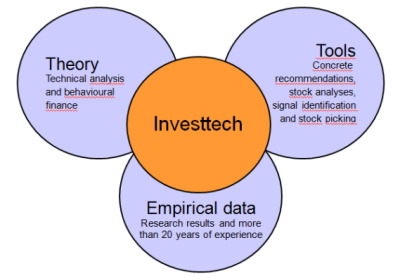
Theory: Technical analysis is a type of financial analysis of listed securities. The main principle is that recent price developments allow you to understand what the buyers and sellers on the market are thinking. You can then tell whether it is buy or sell interest that is increasing. This allows you to deduce what the market players will do tomorrow. By doing this yourself today, you can buy stocks that will rise and sell stocks that will fall.
Hundreds of books have been written on this topic, and particularly in the United States technical analysis has been an established and accepted form of analysis for decades. The theory is based on understanding of human behaviour, but also includes elements from business management.
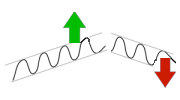
For instance, the theory says that a stock in a rising trend will continue to rise. The reason is that the company is experiencing positive development, that buy interest is increasing and that investors will pay ever more to buy into the stock.
This theory is the foundation of Investtech’s analyses.
Tools: Objective tools are a big advantage when conducting technical analysis. Traditionally investors and analysts have used drawing tools and marked trends and other visual technical indicators where they subjectively think they fit. Working like this makes it easy to see trends and signals where you subconsciously want to see them. It is easy to be mentally influenced by owning the stock, wanting to buy or sell, short term market movements and news regarding the company.
Having tools that automatically conduct the analysis, gives objective analyses. You can consider the psychological movements indicated, viewed from the outside. Building a strategy for trading based on automatic signals and indicators, helps avoid being influenced by personal opinion, also when others tend to make the wrong decisions because emotions get in the way.
Investtech’s analysis tools have been developed since the 1990s. They are built on established technical analysis theory and identify trends, support and resistance, volume development and price patterns with buy and sell signals entirely automatically.
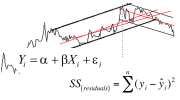
Heavy mathematical and statistical models make up the core of these tools. In order to find the best trend in a medium long term chart, close to 80,000 potential trend options in the chart are analysed. A quality figure, a score, is estimated for each of these trend candidates, based on e.g. how long the trend is, how close it is, how many points are near support at the floor of the channel, and a number of other characteristics. The one trend out of the 80,000 that gets the highest quality score is considered the best trend for the stock and automatically drawn into the chart.
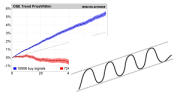
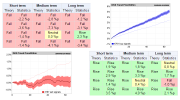
Empirical data: Established theory and solid tools are of no use if the theory fails in practice. Because Investtech has systems for automatic identification of technical indicators, like trends and price patterns, we can also investigate what has historically occurred following such signals.
Most of the technical indicators we have studied have shown a history that supports the theory. However, we have also found results that are the complete opposite of common use of certain technical indicators. Our subscribers can read our research results on our web site www.investtech.com.
The Trend Bible handles all aspects of trends and shows how well the theory has worked in practice on the Oslo Stock Exchange and the other Nordic stock exchanges over the past 20 years.
Thus Investtech’s Analysis Concept is comprehensive: We build on established technical analysis theory and offer tools for signal identification, stock picking and individual stock analysis that are easy to use. We also have broad research into how the signals have performed over time, which is also used in our analyses.
Investtech guarantees neither the entirety nor accuracy of the analyses. Any consequent exposure related to the advice / signals which emerge in the analyses is completely and entirely at the investors own expense and risk. Investtech is not responsible for any loss, either directly or indirectly, which arises as a result of the use of Investtechs analyses. Details of any arising conflicts of interest will always appear in the investment recommendations. Further information about Investtechs analyses can be found here disclaimer.
The content provided by Investtech.com is NOT SEC or FSA regulated and is therefore not intended for US or UK consumers.


 Oslo Børs
 Stockholmsbörsen
 Københavns Fondsbørs
 Helsingin pörssi
 World Indices
 US Stocks
 Toronto Stock Exchange
 London Stock Exchange
 Euronext Amsterdam
 Euronext Brussel
 DAX
DAX CAC 40
 Mumbai S.E.
 Commodities
 Currency
 Cryptocurrency
 Exchange Traded Funds
 Investtech Indices