Global stocks: Three top brand names across different markets
Published August 21, 2019
It was not very easy to find the right topic to write about today. First I thought to write technical analyses for the largest automobile companies in the world which almost everyone would know. But then the charts were not interesting at all. Almost all of the stocks that I browsed through, like Volkswagen, General Motors, Ford Motors, BMW Group and Tesla to name a few, none of them showed a rising trend. Most of them were either in a falling or in a choppy trend.
Hence I decided that I would use Investtech's most reliable tool, which is the stock selection method. It gives freedom to choose and set different parameters like liquidity, market capitalisation, rising/falling trend channel, momentum and volume balance indicators (positive/negative), etc. Next I browsed through different markets for which we do technical analysis. One must note that the system created here, the charts, analysis text, technical score and everything else, is fully automated, based on algorithms that have been created by Investtech's technicians after years of research and hard work.
So here we write about stocks from three different markets which I found were interesting, and above all that are world famous brand names that are among the top players in their individual fields, and you all must have heard or read about them, or must have used their products at some point in your life.
My criteria for today's selection were stocks with liquidity of 100 million or above (either euro, pound or dollar), technically positive with overall technical score above 50. Trust me, there were not many of these stocks across the different markets that I looked into. Though I managed to find three.
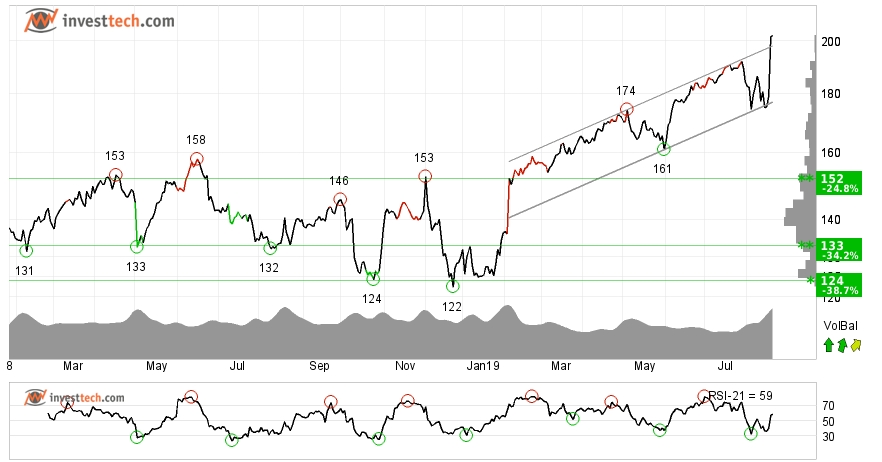
Estee Lauder Cos., Inc (EL.US) Close: 202.20
The Estée Lauder Companies Inc. is a multinational manufacturer and marketer of prestige skincare, makeup, fragrance and hair care products, based in Midtown Manhattan, New York City.
The New York Stock Exchange listed company shows strong development in a rising trend and has broken above the ceiling of the rising trend channel in all time frames; short, medium and long term. This signals increasing optimism among investors who have steadily paid more to buy the stock, which indicates increasing optimism and that the price may continue to rise.
Since 2014, the stock has gained over 200 per cent. In the short term there is no resistance, as the stock is at its all time high. However, in case of a reaction on the downside, there is support around 192-175 dollars.
Short term volume balance and momentum indicators are positive and support the underlying strength in price. The stock is overall assessed as technically positive for the medium term.
Investtech's outlook (one to six months): Positive
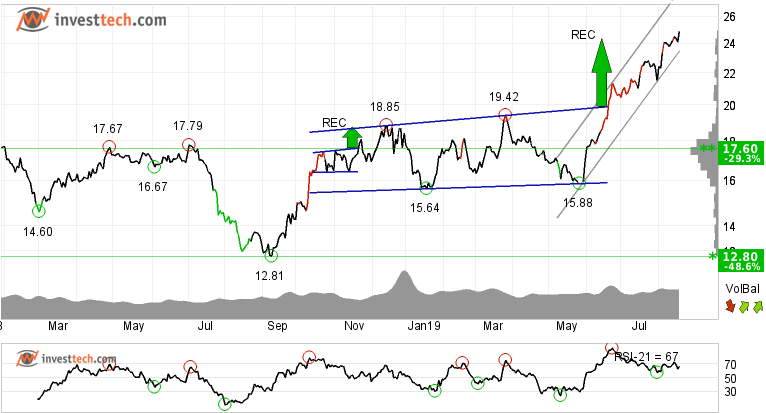
Barrick Gold Corp. (ABX.CA) Close: 24.88
Barrick Gold Corporation is the largest gold mining company in the world, with its headquarters in Toronto, Ontario, Canada, and is listed on the Toronto Stock Exchange.
Barrick Gold Corporation shows strong development within a rising trend channel in the medium and long term. Rising trends indicate that the company experiences positive development and that buy interest among investors is increasing.
The price has risen strongly since the positive signal from rectangle formation at the break through the resistance at 19.91. The objective at 24.36 is now met, but the formation still gives a signal in the same direction. Next resistance is around 26.80 dollars, which is its previous high established in 2017. However, a break above this level would be a positive sign and the stock may rise up to 30 dollars. In case of a short term price correction, there is support between 22.70 and 21.50 dollars.
Positive volume balance strengthens the stock. RSI above 70 shows that the stock has strong positive momentum in the short term. Investors have steadily paid more to buy the stock, which indicates increasing optimism and that the price may continue to rise.
Investtech's outlook (one to six months): Positive
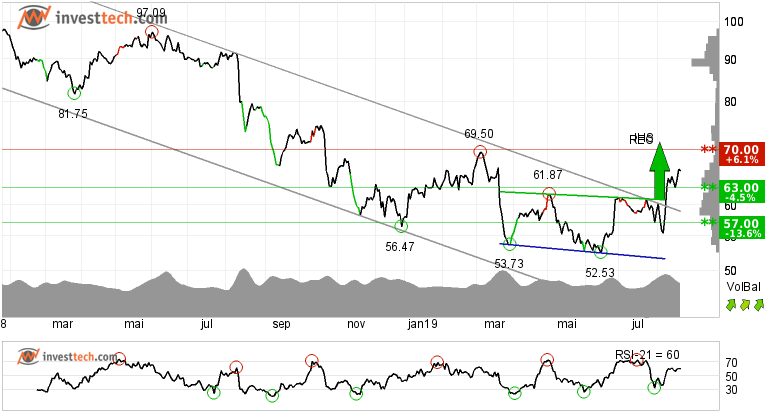
BAYER AG NA (BAYN.DE) Close: 66.00
Bayer AG is a German multinational pharmaceutical and life sciences company and one of the largest pharmaceutical companies in the world.
After shedding almost 54 per cent of its stock value in the past two years, the stock has finally given a buy signal from a rectangle formation in the medium term and has broken above the resistance at 63 euros. It has also given a breakout from an inverted head and shoulders formation both in the medium and long term charts. This signals that optimism among investors is gaining strength and further rise to 71.12 or more is signaled. The stock has support at 63 euros and resistance at 70 euros.
The volume balance indicator is positive and strengthens the stock in all time frames. The short term momentum indicator RSI shows a rising trend, which supports the positive trend. The stock is overall assessed as technically positive for the short to medium term.
Investtech's outlook (one to six months): Positive
The analyses are based on closing price as per August 20, 2019
Note: These instruments are traded in currency based on the Exchange or country they are listed on.
Written by

Analyst - Investtech
"Investtech analyses the psychology of the market and gives concrete trading suggestions every day."

Partner & Senior Advisor - Investtech
Investtech guarantees neither the entirety nor accuracy of the analyses. Any consequent exposure related to the advice / signals which emerge in the analyses is completely and entirely at the investors own expense and risk. Investtech is not responsible for any loss, either directly or indirectly, which arises as a result of the use of Investtechs analyses. Details of any arising conflicts of interest will always appear in the investment recommendations. Further information about Investtechs analyses can be found here disclaimer.
The content provided by Investtech.com is NOT SEC or FSA regulated and is therefore not intended for US or UK consumers.


 Oslo Børs
 Stockholmsbörsen
 Københavns Fondsbørs
 Helsingin pörssi
 World Indices
 US Stocks
 Toronto Stock Exchange
 London Stock Exchange
 Euronext Amsterdam
 Euronext Brussel
 DAX
DAX CAC 40
 Mumbai S.E.
 Commodities
 Currency
 Cryptocurrency
 Exchange Traded Funds
 Investtech Indices


