Price formations
The price chart reflects the fluctuations of investors’ levels of optimism over time. Looking at their ups and downs, we can say something about what they think and feel. And thus something about what they will do next.
Certain patterns, called price formations, can be explained by precise descriptions of the investors’ psychological state. When these patterns are formed in price charts, clear buy or sell signals are triggered. Identification of and trading from price formations are very central to technical analysis.
Investtech has created computer programmes that identify formations and plot them in charts. Buy signals are shown as green arrows and sell signals as red arrows. The height of the arrows denotes expected price movement.
Main principles
- Buy stocks that have triggered buy signals from price formations.
- Sell stocks that have triggered sell signals from price formations.
Top formations
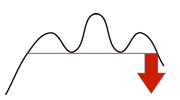
Head and shoulders formation
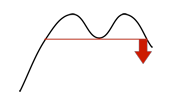
Double top formation
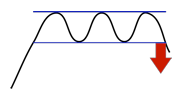
Rectangle formation
- Warn that a rising trend is over and that a falling trend begins
- Sell!
Bottom formations
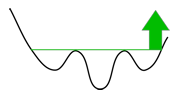
Inverse head and shoulder formation
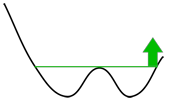
Double bottom formation
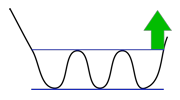
Rectangle formation
- Warn that a falling trend is over and that a rising trend begins
- Buy!
Continuing formations
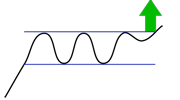
Rectangle formation buy
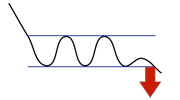
Rectangle formation sell
- Warn that a consolidation is over.
- May trigger a buy signal that says a rising trend will continue up.
- May trigger a sell signal that says a falling trend will continue to fall.
Important details
- The strength of a price movement is described by its volume. Increasing volume strengthens the signal from a formation. A volume reduction often indicates it was a false signal.
- The price often moves significantly immediately after a break. Ideally one should therefore act quickly following a break. However the price will often fall again a little later, so a new opportunity may present itself for those who missed it the first time.
- Even if the price reaches target (the height of the arrow), the stock can often go much further. Price formations indicate a beginning or continuation of trends. Trends are the strongest indicators we have. While the trend remains intact, the stocks should normally be kept.
Buy signal from rectangle formation
A buy signal from a rectangle formation signals increasing optimism among investors and signals that the stock continues or enters a rising trend.
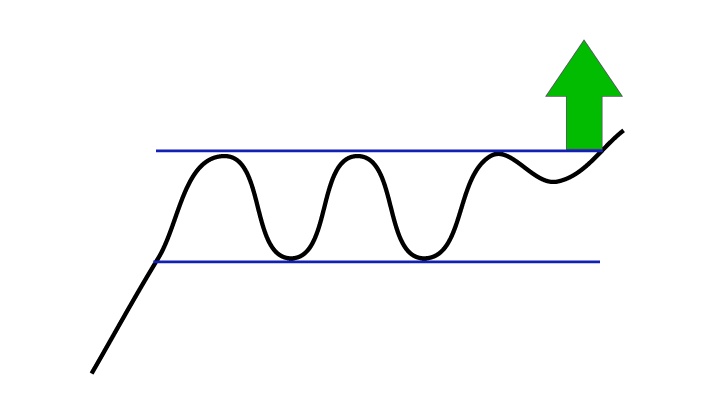
A stock that has triggered a buy signal from a rectangle formation is indicated to rise further. This is especially the case when the stock price is already in a rising trend channel. Investors have experienced a positive surprise which has triggered the signal, and optimism is on the increase.
Details
Volume is a good indicator of the strength of the buy signal. High volume on rising prices indicates that aggressive buyers keep paying more in order to buy. This is positive for further development. High volume and positive volume balance will strengthen a buy signal.
Rectangle formations are usually continuing formations. This means that the price usually continues in the long term direction, or the long term trend, it was in before the formation. Rectangle formations that trigger buy signals in rising trends are therefore seen to give stronger signals than rectangle formations that trigger buy signals in falling trends.
Small rectangle formations can trigger false buy signals. This is especially the case when the formation is small, when the stock remains in a falling trend channel, and when volume development is negative. At buy signal from a rectangle formation the stock as a whole should be assessed, not solely the buy signal. Many investors have bought long term losers too soon following weak buy signals from rectangle formations. The following applies:
- Long rectangle formations are stronger than short ones.
- Buy signals with positive volume development are stronger than buy signals with negative volume development.
- Buy signals when the chart shows a rising trend are stronger than when the chart shows a falling trend.
- Buy signals with a break upward though a falling trend, including break above the previous pivot top, are stronger than if trend and pivot top are not broken.
Investtech research: Buy signal from rectangle formation
statSummaryRelPos statSummaryRelPosNumberSignificant
| Annualised return (based on 66-day figures) | |
| Signaux positifs moyen terme | 19.8% |
| Reference index | 10.8% |
| Excess return | 9.0pp |
statSummaryTemplate
Lire plus
- Research Report: Investtech Research: Return following signals from rectangle formations in stock prices - medium term, Nordic markets, 1996-2018 (Niveau d'accès exigé: PRO)
- Research Article: Sterk meravkastning etter kjøpssignaler fra rektangelformasjoner
- Research Report: Investtech-forskning: Signalstatistikk kursformasjoner under koronapandemien, Norden 2019-2020. (Niveau d'accès exigé: PRO)
- Research Article: Investtech-forskning: Formasjoner gav ikke signifikante signaler under koronapandemien
- Research Report: Investtech-forskning: Kursformasjoner - signalstatistikk Norden 2008-2020 (Niveau d'accès exigé: PRO)
Sell signal from rectangle formation
A sell signal from a rectangle formation signals increasing pessimism among investors and signals that the stock continues or enters a falling trend.
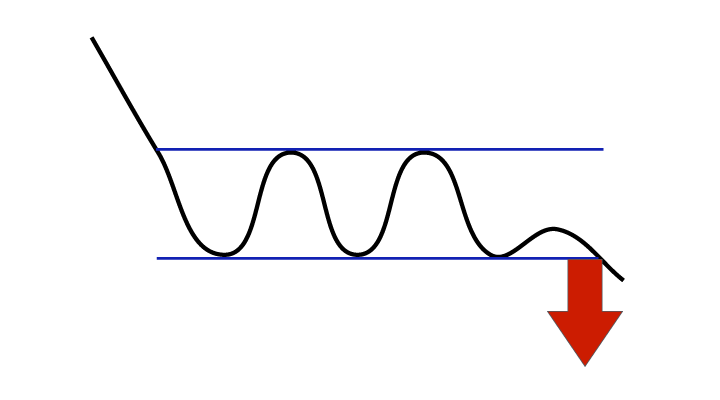
A stock that has triggered a sell signal from a rectangle formation is indicated to fall further. This is especially the case when the stock price is already in a falling trend channel. Investors have experienced a negative surprise which has triggered the signal, and the level of fear is increasing.
Details
Volume is a good indicator of the strength of the sell signal. High volume on falling prices indicates that aggressive sellers keep reducing the price in order to sell. This is negative for further development. High volume and negative volume balance will strengthen a sell signal.
Rectangle formations are usually continuing formations. This means that the price usually continues in the long term direction, or the long term trend, it was in before the formation. Rectangle formations that trigger sell signals in falling trends are therefore seen to give stronger signals than rectangle formations that trigger sell signals in rising trends.
Small rectangle formations can trigger false sell signals. This is especially the case when the formation is small, when the stock remains in a rising trend channel, and when volume development is positive. At sell signal from a rectangle formation the stock as a whole should be assessed, not solely the sell signal. Many investors have sold long term winners too soon following weak sell signals from rectangle formations. The following applies:
- Long rectangle formations are stronger than short ones.
- Sell signals with negative volume development are stronger than sell signals with positive volume development.
- Sell signals when the chart shows a falling trend are stronger than when the chart shows a rising trend.
- Sell signals with a break downward from a rising trend, including break below the previous pivot bottom, are stronger than if trend and pivot bottom are not broken.
Investtech research: Sell signal from rectangle formation
statSummaryRelNeg statSummaryRelNegNumberSignificant
| Annualised return (based on 66-day figures) | |
| Signaux négatifs moyen terme | 4.3% |
| Reference index | 10.9% |
| Excess return | -6.6pp |
statSummaryTemplate
Lire plus
- Research Report: Investtech Research: Return following signals from rectangle formations in stock prices - medium term, Nordic markets, 1996-2018 (Niveau d'accès exigé: PRO)
- Research Article: Gode salgssignaler fra rektangelformasjoner
- Research Report: Investtech-forskning: Signalstatistikk kursformasjoner under koronapandemien, Norden 2019-2020. (Niveau d'accès exigé: PRO)
- Research Article: Investtech-forskning: Formasjoner gav ikke signifikante signaler under koronapandemien
- Research Report: Investtech-forskning: Kursformasjoner - signalstatistikk Norden 2008-2020 (Niveau d'accès exigé: PRO)
Developing rectangle formation
A rectangle formation marks a market consolidation. The longer the formation is developing, the higher pressure builds among the investors. When the formation is broken, a strong price movement in the same direction tends to happen.
Buy signals from such formations have given statistically good results, according to Investtech’s research report for several stock exchanges.

Pay attention when rectangle formations are developing. Strong buy signals can follow, especially if the price is also in a rising trend and volume development is positive. Breaks downward give strong sell signals, especially when the price is also in a falling trend and volume development is negative.
Inverse head and shoulders formation
A buy signal from an inverse head and shoulders formation signals increasing optimism among investors and the beginning of a rising trend. Formations like this are considered some of the most reliable formations in technical analysis.
An inverse head and shoulders formation is a bottom formation which marks the end of a falling trend. The formation consists of a left shoulder, a head and a right shoulder, connected by a neckline. The buy signal is triggered when the price breaks upwards through the neckline heading up from the right shoulder.
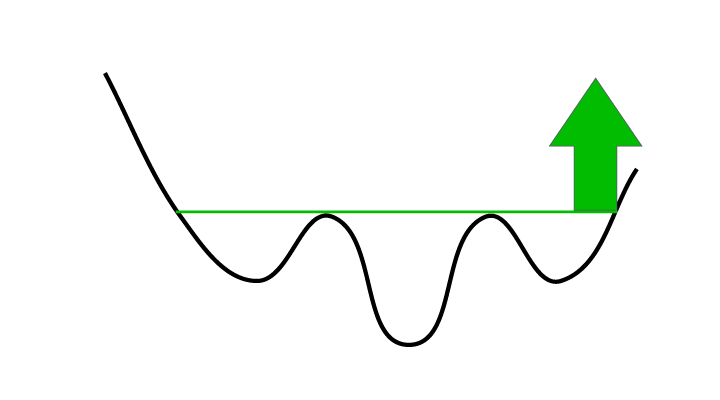
On the left shoulder investors are negative. The trend is falling and it does not look good for the company. As the pessimism wanes, the head is formed. Here the stock might break out from a falling trend channel and buyers become more aggressive or sellers more passive. On the right shoulder, the pessimists are unable to push the price downwards to a new bottom. Instead buyers push the price upwards through the neckline and the buy signal is triggered. The stock breaks upwards through resistance at the neckline and a rising trend begins.
A stock that has triggered a buy signal from an inverse head and shoulders formation is indicated to continue rising, for at least as long as the formation is high.
Please note that false buy signals from small inverse head and shoulders formations may arise in long term falling trends. Sometimes these can be spotted by a reduction in volume on the break. This indicates little strength in the price movement, and the stock can easily break down again and continue the falling trend. In such situations it can be advantageous to keep the stock and wait to see what happens also after the buy signal. This is especially the case if the stock is still in a falling trend or faces resistance from previous tops.
Sometimes good indicators of a coming break exist before the neckline is broken. Volume reduction on or towards the bottom of the right shoulder indicates that the sellers are passive. Increasing volume on the way up from the head or up from the right shoulder indicates that buyers are aggressive. Aggressive buyers and passive sellers are a good mix and a clear indication of increasing optimism in the stock and a coming break upward. In such situations it can be advantageous to buy before the buy signal is triggered.
Investtech research: Inverse head and shoulders formation
statSummaryRelPos statSummaryRelPosNumberSignificant
| Annualised return (based on 66-day figures) | |
| Signaux positifs moyen terme | 14.0% |
| Reference index | 9.7% |
| Excess return | 4.3pp |
statSummaryTemplate
Lire plus
- Research Report: Investtech Research: Return following signals from inverse/head and shoulders formations in stock prices - medium term, Nordic markets 1996-2018
- Research Article: Meravkastning etter kjøpssignaler fra omvendt-hode-og-skuldre-formasjoner
- Research Report: Investtech-forskning: Kursformasjoner - signalstatistikk Norden 2008-2020 (Niveau d'accès exigé: PRO)
- Research Article: Investtech-forskning: Kursformasjoner 2008 - 2020
Developing inverse head and shoulders formation
A potential inverse head and shoulders formation is developing. It may trigger a strong buy signal.
Signals from such formations are considered some of the strongest buy signals in technical analysis. Please note that such a signal may be triggered soon. In some situations it may be advantageous to sell before the buy signal is triggered, as this gives a much bigger upside.
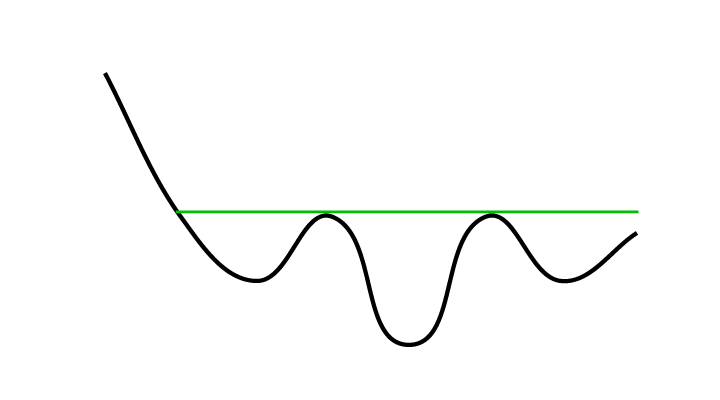
Important indicators of a developing break upwards are:
- Positive volume balance
- Break through falling trend
- Increasing volume up from the head
- Decreasing volume heading down towards right shoulder
- Increasing volume heading up from right shoulder
However, if volume development is negative and the stock remains in a falling trend, it indicates fear among investors and further negative development for the stock.
Head and shoulders formation
A sell signal from a head and shoulders formation signals increasing pessimism among investors and the start of a falling trend. Formations like this are considered some of the most reliable formations in technical analysis.
A head and shoulders formation is a top formation which marks the end of a rising period. The formation consists of a left shoulder, a head and a right shoulder, connected by a neckline. The sell signal is triggered when the price breaks downwards through the neckline heading down from the right shoulder.
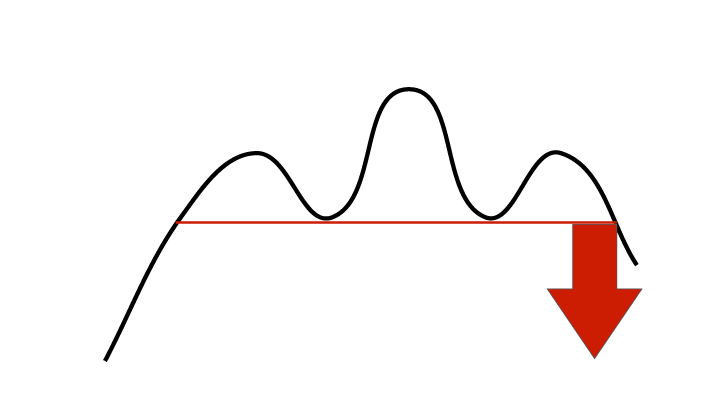
At the left shoulder, investors are optimistic. The trend is rising and things are looking good for the company. Optimism is reduced when the head is formed. Here the stock might break out from the trend channel and buyers become more passive or sellers more aggressive. At the right shoulder, the optimists are unable to push the price upwards to a new top. Instead sellers push the price downwards through the neckline and a sell signal is triggered.
The stock breaks support at the neckline and a falling trend begins. A stock that has triggered a sell signal from a head and shoulders formation is indicated to continue falling, for at least as long as the formation is high.
Please note that false sell signals from small head and shoulders formations may arise in long term rising trends. Sometimes these can be spotted by a reduction in volume on the break. This indicates little strength in the price movement, and the stock can easily break upwards again and continue the rising trend. In such situations it can be advantageous to keep the stock and wait to see what happens also after the sell signal. This is especially the case if the stock is still in a rising trend or has support from previous bottoms.
Sometimes good indicators of a coming break exist before the neckline is broken. Volume reduction on or towards the top of the right shoulder indicates that the buyers are passive. Increasing volume on the way down from the head or down from the right shoulder indicates that sellers are aggressive. Passive buyers and aggressive sellers are a bad mix and a clear indication of increasing pessimism in the stock and a coming break downward. In such situations it can be advantageous to sell before the sell signal is triggered.
Investtech research: Head and shoulders formation
statSummaryRelNeg statSummaryRelNegNumber
| Annualised return (based on 66-day figures) | |
| Signaux négatifs moyen terme | 8.3% |
| Reference index | 9.3% |
| Excess return | -1.0pp |
statSummaryTemplate
Lire plus
- Research Report: Investtech Research: Return following signals from inverse/head and shoulders formations in stock prices - medium term, Nordic markets 1996-2018
- Research Article: Salgssignaler fra hode-og-skuldre-formasjoner har varierende prediksjonskraft
- Research Report: Investtech-forskning: Kursformasjoner - signalstatistikk Norden 2008-2020 (Niveau d'accès exigé: PRO)
- Research Article: Investtech-forskning: Kursformasjoner 2008 - 2020
Developing head and shoulders formation
A potential head and shoulders formation is developing. It may trigger a strong sell signal.
Signals from such formations are considered some of the strongest sell signals in technical analysis. Please note that such a signal may be triggered soon. In some situations it may be advantageous to sell before the sell signal is triggered, to avoid the risk of a bigger loss.

Important warning signs are:
- Negative volume balance
- Break through rising trend
- Increasing volume down from the head
- Decreasing volume heading up towards right shoulder
- Increasing volume heading down from right shoulder
However, if volume development is positive and the stock remains in a rising trend, it indicates optimism among investors and further positive development for the stock.
Buy signal from double bottom formation
A buy signal from a double bottom formation signals increasing optimism among investors and the beginning of a rising trend.
A double bottom formation is a bottom formation which marks the end of a falling period. The formation consists of two bottoms of about the same depth. The buy signal is triggered when the price breaks upwards above the bottoms.

At the first bottom the investors are pessimistic. There is a falling trend and things are not looking good for the company. As the second bottom is formed, the pessimism is reduced. Many are positively surprised when the stock does not fall below the previous bottom, and thus might not continue the falling trend. When the price breaks above the top between the bottoms, it breaks the resistance located there. Pessimism has been replaced with dawning optimism and a rising trend has begun.
A stock that has triggered a buy signal from a double bottom formation is indicated to rise further, for at least as much as the formation is high.
Details
Double bottom formations trigger false buy signals fairly often. This is especially the case when the formation is small, when the stock remains in a falling trend channel, and when volume development is negative. At buy signal from a double bottom formation the stock as a whole should be assessed, not solely the buy signal. Many investors have bought losing stocks too soon following weak signals from double bottom formations. The following applies:
- Large double bottom formations are stronger than small ones.
- Buy signals with positive volume development are stronger than buy signals with negative volume development.
- Buy signals with a clear break through a falling trend, including break above the previous pivot top, are stronger than without breaks through trend and pivot top.
Investtech research: Buy signal from double bottom formation
statSummaryRelNeg statSummaryRelNegNumber
| Annualised return (based on 66-day figures) | |
| Signaux positifs moyen terme | 7.5% |
| Reference index | 9.5% |
| Excess return | -2.0pp |
statSummaryTemplate
Lire plus
- Research Report: Investtech Research: Return following signals from double top/bottom formations in stock prices - medium term, Nordic markets 1996-2018 (Niveau d'accès exigé: PRO)
- Research Article: Investtech-forskning: Kjøpssignaler fra kortsiktige dobbel bunn-formasjoner går mot etablert teknisk analyse-teori
- Research Report: Investtech-forskning: Kursformasjoner - signalstatistikk Norden 2008-2020 (Niveau d'accès exigé: PRO)
- Research Article: Investtech-forskning: Kursformasjoner 2008 - 2020
Sell signal from double top formation
A sell signal from a double top formation signals increasing pessimism among investors and the beginning of a falling trend.
A double top formation is a top formation which marks the end of a rising trend. The formation consists of two tops of about the same height. The sell signal is triggered when the price breaks down below the tops.

At the first top, investors are optimists. The trend is rising and things are looking good for the company. As the second top is formed, the optimism wanes. Many are disappointed when the stock does not reach above the previous top and thereby possibly does not continue the rising trend. When the price breaks down below the bottom between the two tops, the support there is broken. Optimism has been replaced with pessimism and a falling trend has begun.
A stock that has triggered a sell signal from a double top formation is indicated to continue falling, for at least as long as the formation is high.
Details
False sell signals are triggered fairly often from double top formations. This is especially the case when it is a small formation, when the stock is still in a rising trend channel and when volume development is positive. At a sell signal from a double top formation the stock as a whole should be assessed, not solely the sell signal. Many investors have sold long term winners too soon following weak signals from double top formations. The following applies:
- Big double top formations are stronger than small ones.
- Sell signals with negative volume development are stronger than sell signals with positive volume development.
- Sell signals with a clear break down from a rising trend, including break below the previous pivot bottom, are stronger than if the trend and pivot bottom have not been broken.
Investtech research: Sell signal from double top formation
statSummaryRelPos statSummaryRelPosNumber
| Annualised return (based on 66-day figures) | |
| Signaux négatifs moyen terme | 13.4% |
| Reference index | 11.6% |
| Excess return | 1.8pp |
statSummaryTemplate
Lire plus
- Research Report: Investtech Research: Return following signals from double top/bottom formations in stock prices - medium term, Nordic markets 1996-2018 (Niveau d'accès exigé: PRO)
- Research Article: Investtech-forskning: Salgssignaler fra dobbel topp-formasjoner har liten signalkraft
- Research Report: Investtech-forskning: Kursformasjoner - signalstatistikk Norden 2008-2020 (Niveau d'accès exigé: PRO)
- Research Article: Investtech-forskning: Kursformasjoner 2008 - 2020
Investtech guarantees neither the entirety nor accuracy of the analyses. Any consequent exposure related to the advice / signals which emerge in the analyses is completely and entirely at the investors own expense and risk. Investtech is not responsible for any loss, either directly or indirectly, which arises as a result of the use of Investtechs analyses. Details of any arising conflicts of interest will always appear in the investment recommendations. Further information about Investtechs analyses can be found here disclaimer.
The content provided by Investtech.com is NOT SEC or FSA regulated and is therefore not intended for US or UK consumers.


 Oslo Børs
 Stockholmsbörsen
 Københavns Fondsbørs
 Helsingin pörssi
 World Indices
 US Stocks
 Toronto Stock Exchange
 London Stock Exchange
 Euronext Amsterdam
 Euronext Brussel
 DAX
DAX CAC 40
 Mumbai S.E.
 Commodities
 Currency
 Cryptocurrency
 Exchange Traded Funds
 Investtech Indices