Analysis News

  • De beste nieuwbrief op de markt
  • Toegepasta an uw behoeften
  • Gratis e-mail iedere dag voor beurs

Receive Analysis News:

E-mail:

Free daily newsletter every morning

Content
Signaux
Tous les indices - Moyen terme
ENGIE25. avr 2025
Nyxoah SA25. avr 2025
Tessenderlo Chemie NV25. avr 2025
Sequana medical NV25. avr 2025
Solvac S.A.25. avr 2025

The market showed a small gain vendredi, and Bel20 (BEL20) ended the day at 4306 points, which is an increase of 0.4 percent. The week as a whole showed a gain of 2.6%. L'indice has now closed up for the fourth day in a row.

65 shares showed a gain and 40 showed a loss. 9 shares were unchanged and closed at the same price as the previous day. There was no trading in 36 shares.

Total value of the trading volume for shares and primary capital certificates vendredi was approximately 0.9 billion.

ENGIE (ENGI) closed at 17.43 euro after a steep drop of 6.8 percent. L'action has never lost more in one day since juin 16. 2022, when it was down 7.3 percent. L'action triggered a sell signal by the break down through the support at 17.46 euro in formation double sommet. A further drop to 16.13 euro within one month is indicated.
Syensqo S.A. (SYENS) closed at 60.28 euro after a small loss of 0.3 percent. L'action thereby reversed down after nine days of gains. It does not look good technically either. L'action is trend wise negative in the medium term, has resistance at 69.00 euro and a further decline is indicated.
AHOLD DEL (AD) declined slightly 0.6 percent and ended the day at 35.70 euro. L'action thereby reversed down after seven days of gains. It does, however, look good technically. L'action is trend wise positive in the medium term and a further increase is indicated.
Cofinimmo (COFB) gained 1.6 percent to 65.70 euro. L'action has not closed higher since octobre 2024. L'action has thereby closed up nine out of the past ten days. L'action has by that gained 19.1 percent since the buy signal from formation rectangulaire three months ago.
GALAPAGOS (GLPG) developed positively, and gained 1.8 percent to a close of 23.40 euro. L'action has now risen for the sixth day in a row and this past week l'action has gained as much as 7.9 percent. It does, however, not look good technically. L'action is trend wise negative in the medium term and a further decline is indicated.

Euronext Amsterdam rises for the fourth day in a row
AEX-index (AEX) moved more or less horizontally on vendredi and closed at 873 points (+0.1 percent). The week as a whole showed a gain of 2.4%. L'indice has now closed up for the fourth day in a row.

US 500 rises for the fourth day in a row
The market moved up vendredi, and S&P 500 (SP500) ended at 5525 points, which is an increase of 0.7 percent. The week as a whole showed a gain of 4.6%. L'indice has now closed up for the fourth day in a row.

Indices
Bel20
arrow yellow   A surveiller
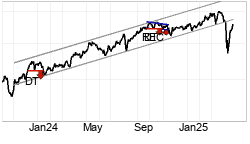
Bel20 a débordé le plancher du canal haussier, ce qui dans un premier temps, indique un taux de croissance plus faible. L'indice teste la résistance à environ 4320 points. Cela doit normalement donner une correction, Cependant un franchissement de 4320 points déclenche un signal d'achat. L'indice est considéré comme neutre technique pour moyen long terme.
AEX-index
arrow yellow   A surveiller
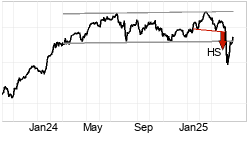
AEX-index fluctue dans un canal presque horizontal et un développement dans la même direction est indiqué. L’indicateur de la moyenne mobile a donné un signal de vente, cela signale donc une poursuite de la correction. L'indice a franchi la résistance à environ 860 points. Une poursuite de la hausse est donc indiquée, et il y a maintenant un support à 860 points en cas de corrections. L'indice est généralement considéré comme neutre technique pour moyen long terme.
S&P 500
arrow green   Candidat légèrement positif
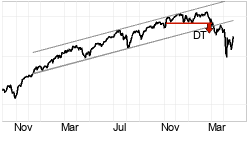
S&P 500 a débordé le plancher du canal haussier, ce qui dans un premier temps, indique un taux de croissance plus faible. Le titre a franchi un niveau de résistance sur le court terme et la stratégie de trading range court terme a donné un signal d'achat. L'indice rencontre du support à environ 5200 points et de la résistance à environ 5820 points. L'indice est généralement considéré comme légèrement positif technique pour moyen long terme.
Cas du jour
Ackermans & van Haaren NV (ACKB) Cours 211.00, 25. avr 2025
chart
Ackermans & van Haaren NV progresse fortement dans un canal haussier. Pour la suite, la progression reste bien orientée et il y a du support en bas du canal haussier. En plus la valeur a franchi un niveau de résistance et la stratégie de trading range long terme a donné un signal d'achat. L'action a un support à environ 192 euro. La balance des volumes négative affaiblit la valeur sur le court terme. L'action est généralement considéré comme positif technique pour moyen long terme.
Recommendation: Positif
Index du jour précédent
AEX0.10%872.84
CAC400.27%7502.78
COMPX1.26%17383.00
DAX0.81%22242
HEX0.30%9730.15
N1000.65%1501.19
OMXC25GI0.27%1898.03
OMXSPI0.92%924.31
OSEBX0.29%1456.43
PSI200.93%6942.73
TECDAX0.14%3588.29
BUK100P0.04%837.77
EURUSD0.06%1.1400
CL (OIL)0.37%63.02
Estimations d'index
 CML
AEXnegneutralpos
CAC40negpospos
COMPXpospospos
DAXnegpospos
HEXnegposneg
N100neutralpospos
OMXC25GInegnegpos
OMXSPInegnegpos
OSEBXnegnegneutral
PSI20negpospos
TECDAXnegpospos
BUK100Pnegneutralpos
EURUSDpospospos
CL (OIL)negnegneg

C: Court terme.    M: Moyen terme.    L: Long terme .
Baromètre de bourse
BEL 20 - Moyen terme
 
      
35% 25% 40%
 7 Candidats positifs intéressants
 5 A surveiller
 8 Candidats négatifs intéressants
Conditions générales d'utilisation et avis de précaution Copyright © 2025 Investtech.com AS, Org nr 978 655 424 MVA


Investtech guarantees neither the entirety nor accuracy of the analyses. Any consequent exposure related to the advice / signals which emerge in the analyses is completely and entirely at the investors own expense and risk. Investtech is not responsible for any loss, either directly or indirectly, which arises as a result of the use of Investtechs analyses. Details of any arising conflicts of interest will always appear in the investment recommendations. Further information about Investtechs analyses can be found here disclaimer. The content provided by Investtech.com is NOT SEC or FSA regulated and is therefore not intended for US or UK consumers.

Cancel Analysis News
[ Back to default newsletter setup ]

Edit AnalysisNews

Register as a recipient of AnalysisNews in order to customise the content.


Investtech guarantees neither the entirety nor accuracy of the analyses. Any consequent exposure related to the advice / signals which emerge in the analyses is completely and entirely at the investors own expense and risk. Investtech is not responsible for any loss, either directly or indirectly, which arises as a result of the use of Investtechs analyses. Details of any arising conflicts of interest will always appear in the investment recommendations. Further information about Investtechs analyses can be found here disclaimer. The content provided by Investtech.com is NOT SEC or FSA regulated and is therefore not intended for US or UK consumers.


Investtech guarantees neither the entirety nor accuracy of the analyses. Any consequent exposure related to the advice / signals which emerge in the analyses is completely and entirely at the investors own expense and risk. Investtech is not responsible for any loss, either directly or indirectly, which arises as a result of the use of Investtechs analyses. Details of any arising conflicts of interest will always appear in the investment recommendations. Further information about Investtechs analyses can be found here disclaimer. The content provided by Investtech.com is NOT SEC or FSA regulated and is therefore not intended for US or UK consumers.

Titlex

OK
+

Cookie consent

We use cookies to give you a better user experience. If you continue to use the website, you accept this. For further details click here.