Research Results – Breaks Upwards and Downwards from Trends
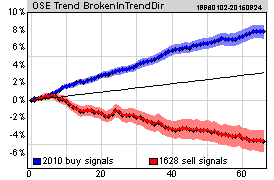
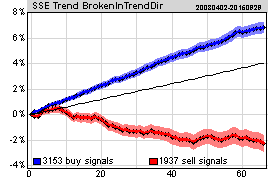
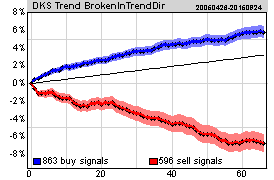
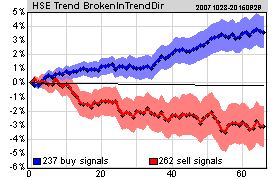
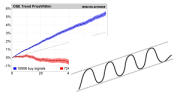
Figure 1: Breaks in the trend direction. Average price development for stocks breaking upwards through the ceiling of rising trends and downwards through the floor of falling trends in Investtech’s medium long term technical charts.
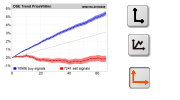
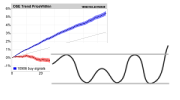
Figure 2: Breaks opposite of trend direction. Average price development for stocks breaking downwards through the floor of rising trend and upwards through the ceiling of falling trend in Investtech’s medium long term technical charts.
| Relative return, rising trends and breaks | Norway | Sweden | Denmark | Finland | Weighted average |
| Breaking upwards from rising trend | 4.7 ppt | 2.8 ppt | 2.6 ppt | 1.1 ppt | 3.3 ppt |
| Within rising trend | 2.3 ppt | 1.5 ppt | 2.3 ppt | 0.2 ppt | 1.8 ppt |
| Breaking downwards from rising trend | 0.4 ppt | 0.4 ppt | 1.1 ppt | -0.6 ppt | 0.4 ppt |
| Relative return, falling trends and breaks | Norway | Sweden | Denmark | Finland | Weighted average |
| Breaking downwards from falling trend | -7.8 ppt | -6.3 ppt | -9.9 ppt | -5.6 ppt | -7.3 ppt |
| Within falling trend | -3.2 ppt | -2.0 ppt | -4.9 ppt | -2.0 ppt | -2.8 ppt |
| Breaking upwards from falling trend | -0.2 ppt | 0.3 ppt | -1.1 ppt | 1.3 ppt | 0.0 ppt |
ppt: percentage points
The charts and tables above show that stocks in rising trends with breaks upwards continue to rise with a stronger rate of increase than stocks within rising trends. Stocks with breaks downwards from rising trends have also continued upwards, but at a rate of increase clearly weaker than stocks within a rising trend and only barely above the market development.
Stocks breaking downwards through the floor of a falling trend have seen very negative further development with a fall of 7.3 percentage points more than benchmark for the weighted average of all the Nordic signals. This is clearly weaker than stocks within a falling trend. Stocks that have broken upwards through the ceiling of a falling trend have developed neutrally compared to the marked in the coming period, which in absolute number gives a rise of 3.5 per cent in the next three months.
The above results fit well with technical analysis theory on breaks from trends. Breaks upwards have given rising prices and stronger rate of increase than earlier. Breaks downwards from rising trends have given continued rise but at a weaker rate of increase. Breaks downward from falling trends have given further fall at a stronger rate of decrease than before.
The results contradict the theory for one indicator: breaks upwards from falling trends. This has not given further fall, but instead an increase in line with the market.
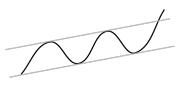
Rising trend breaking upwards. Read the theory and see which stocks are currently breaking upwards through the ceiling of rising trends.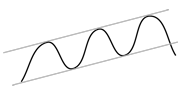
Rising trends breaking downwards. Read the theory and see examples here.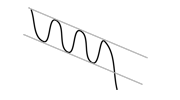
Falling trend breaking downwards. Read the theory and see which stocks are currently breaking downwards from falling trends.
Investtech guarantees neither the entirety nor accuracy of the analyses. Any consequent exposure related to the advice / signals which emerge in the analyses is completely and entirely at the investors own expense and risk. Investtech is not responsible for any loss, either directly or indirectly, which arises as a result of the use of Investtechs analyses. Details of any arising conflicts of interest will always appear in the investment recommendations. Further information about Investtechs analyses can be found here disclaimer.
The content provided by Investtech.com is NOT SEC or FSA regulated and is therefore not intended for US or UK consumers.


 Oslo Børs
 Stockholmsbörsen
 Københavns Fondsbørs
 Helsingin pörssi
 World Indices
 US Stocks
 Toronto Stock Exchange
 London Stock Exchange
 Euronext Amsterdam
 Euronext Brussel
 DAX
DAX CAC 40
 Mumbai S.E.
 Commodities
 Currency
 Cryptocurrency
 Exchange Traded Funds
 Investtech Indices