
 Oslo Børs
 Stockholmsbörsen
 Københavns Fondsbørs
Investeringsforeninger
Københavns Fondsbørs
Investeringsforeninger
 Helsingin pörssi
 World Indices
 US Stocks
US 30
Nasdaq 100
US 500
US Stocks
US 30
Nasdaq 100
US 500
 Toronto Stock Exchange
 London Stock Exchange
 Euronext Amsterdam
 Euronext Brussel
 DAX
SDAX
TECDAX
Frankfurt
CDAX
MDAX
Prime Standard
DAX
SDAX
TECDAX
Frankfurt
CDAX
MDAX
Prime Standard
 CAC 40
 Mumbai S.E.
National S.E.
Mumbai S.E.
National S.E.
 Commodities
 Currency
 Cryptocurrency
 Exchange Traded Funds
 Investtech Indices
The Trend Bible
 Tlf: (+45) 89 88 85 17
 Send e-mail
 Bliv ringet op
 Besøg os
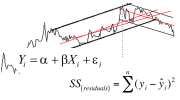
Investtech has developed automatic algorithms for trend identification. Every day these find the best trend in the chart, where the criteria include amongst others the density of the trend, deviation from regression, and number of points near floor and ceiling.
Trend Identification Algorithm
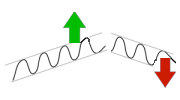
In the old days, as described in Investtechs book on technical stock analysis, visual technical analysis was conducted manually: "Study price movements in order to identify a trend. The price rarely moves in a straight line, but rather as a series of tops and bottoms. If you can draw a straight line between two or more rising bottoms, this is the support line of a rising trend, see figure 1. Then draw a parallel line through the rising tops. This line is called the trends resistance line, and support and resistance combined make up the trend, see figure 2.
Figure 1. Support line of rising trend.

Figure 2. Rising trend with support line and resistance line.
Similarly you get a falling trend if you can draw a straight line through two or more falling tops and a parallel line though falling bottoms
Many investors still identify trends by studying charts and drawing trend lines by hand. The key weakness of this method is its subjective nature, allowing you to see the trends you want to see which may also fit in with your subconscious preferences. It is also very time consuming.
Now, though, good tools for such analysis are available. Investtech has developed automatic algorithms for trend identification. Every day these find the best trend in the chart, where included criteria amongst others are the density of the trend, deviation from regression and number of points near floor and ceiling. In an Investtech chart for the medium long term, with 18 months history, approximately 80,000 different trend alternatives are assessed every day. Each is assigned a score, and the one with the highest score is selected.
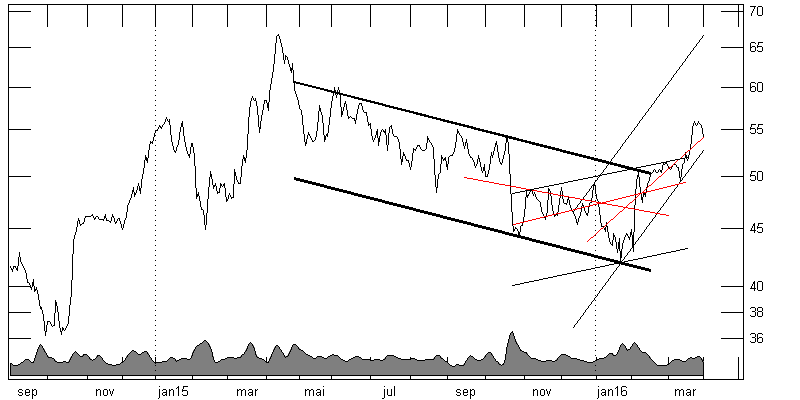
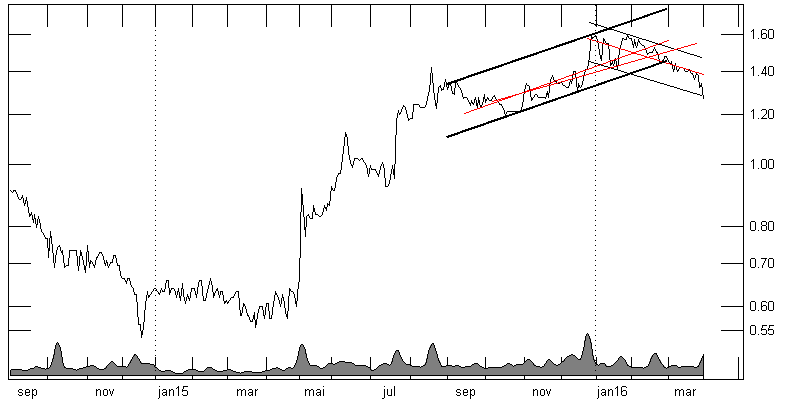
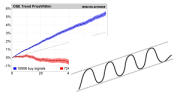
Figure 3: It can be hard to tell whether a stock is in a rising, sideways or falling trend, and whether a trend channel is broken out of or not. It is useful to have a tool that identifies this based on objective mathematical criteria.
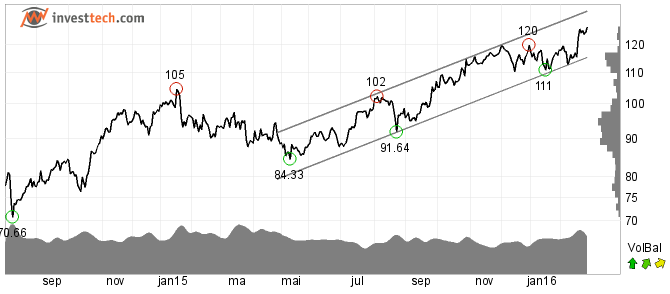
Figure 4. Example of a rising trend identified by Investtechs systems. Norwegian stock Marine Harvest in February 2016. The stock is in a rising trend channel, has triggered buy signal from rising trend and the rise is indicated to continue.
Investtechs forskningsværk baseret på studier af mere end 350.000 signaler fra trender
i børsnoterede nordiske aktier fra 1996 til 2015.
Praktisk brug - Værktøj - Statistik - Algoritmer - Teori
Trendbibelen - startside Mere om Investtechs forskning

Trendbibelen er skrevet af Investtechs forskningschef Geir Linløkken i 2016. Forskningsteamet bag Trendbibelen består af seniorforskerne Asbjørn Taugbøl og Fredrik Tyvand samt Linløkken selv.
Investtech har arbejdet med forskning inden for adfærdsbaseret finans og teknisk og kvantitativ aktieanalyse siden 1997. Virksomheden har udviklet et analysesystem, der blandt andet identificerer trender, støtte og modstand, formationer og volumenmønstre i aktiekurser, og giver købs- og salgsanbefalinger baseret på dette. Investtech gør udstrakt brug af avancerede matematiske algoritmer og tunge statistiske metoder i sine dataprogrammer og internettbaserede abonnementstjenester.
Investtech guarantees neither the entirety nor accuracy of the analyses. Any consequent exposure related to the advice / signals which emerge in the analyses is completely and entirely at the investors own expense and risk. Investtech is not responsible for any loss, either directly or indirectly, which arises as a result of the use of Investtechs analyses. Details of any arising conflicts of interest will always appear in the investment recommendations. Further information about Investtechs analyses can be found here disclaimer.
The content provided by Investtech.com is NOT SEC or FSA regulated and is therefore not intended for US or UK consumers.
Copyright Ⓒ 1997-2024 Investtech.com AS, Org nr 978 655 424 MVA Privacy Policy | Conditions générales d'utilisation et avis de précaution
Head office
Strandveien 171366 Lysaker, Norway
Research department
Instituttveien 102007 Kjeller, Norway