
 Oslo Børs
 Stockholmsbörsen
 Københavns Fondsbørs
Investeringsforeninger
Københavns Fondsbørs
Investeringsforeninger
 Helsingin pörssi
 World Indices
 US Stocks
US 30
Nasdaq 100
US 500
US Stocks
US 30
Nasdaq 100
US 500
 Toronto Stock Exchange
 London Stock Exchange
 Euronext Amsterdam
 Euronext Brussel
 DAX
SDAX
TECDAX
Frankfurt
CDAX
MDAX
Prime Standard
DAX
SDAX
TECDAX
Frankfurt
CDAX
MDAX
Prime Standard
 CAC 40
 Mumbai S.E.
National S.E.
Mumbai S.E.
National S.E.
 Commodities
 Currency
 Cryptocurrency
 Exchange Traded Funds
 Investtech Indices
Cement stocks are posing good opportunity
Published March 12, 2019
We have been watching cement stocks for a while and were waiting for them to give a proper breakout. And here it comes. Almost all cement stocks are establishing bottoms in the medium term charts and a few have given price-volume breakouts in the shorter time frame.
Of the four cement stocks that we have mentioned here today, JK Cement looks very similar to The India Cement Limited chart (differs in volume), and ACC Limited gives a similar feel as Ambuja Cements Limited.
JK Cement Limited (JKCEMENT.NS) Close: 827.05
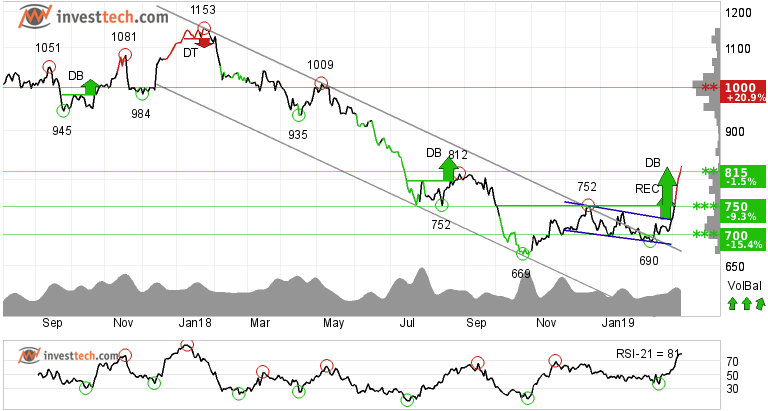
JK Cement Limited has broken out of the falling trend channel in the medium term and has given buy signals from double bottom and rectangle formations. The stock has initiated a buy in the long term chart as well, from a double bottom formation.
The price has broken out of resistance levels on few occasions and now there is support around 815 and 750 levels. Resistance as seen in the medium term chart is around 1000 rupees. Hence reward to risk is favourable at 2.3.
Volume tops and volume bottoms correspond well with tops and bottoms in the price. Volume balance is also positive, which strengthens the stock. RSI above 70 shows that the stock has strong positive momentum in the short term. The stock is overall assessed as technically positive in the short to medium term.
Recommendation one to six months: Positive
The India Cements Limi (INDIACEM.NS) Close: 103.80
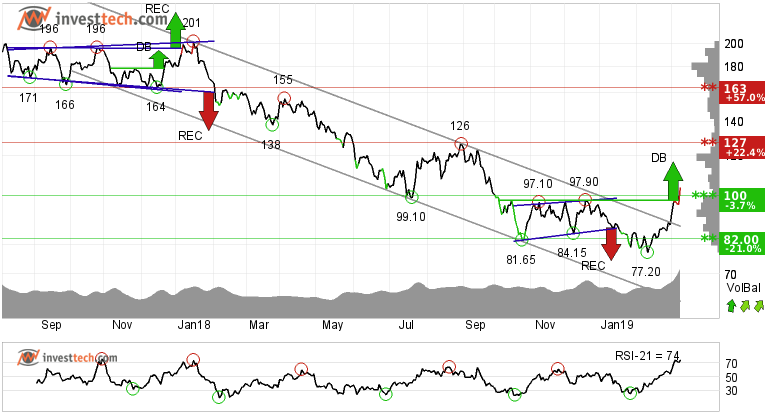
After being in a downtrend channel for over a year, The India Cement Limited stock has given a breakout and is now above its resistance around 100 rupees. Further upside is expected. The stock has support between 97 and 84 rupees in the short term. There is resistance further up around 127 and 163 rupees.
Volume balance is also positive, which strengthens the stock. RSI above 70 shows that the stock has strong positive momentum in the short term. This indicates that the optimism among investors is high and that buy interest is increasing, thus the price is expected to continue to rise. The stock is overall assessed as technically positive in the short to medium term.
Recommendation one to six months: Positive
ACC Limited (ACC.NS) Close: 1604.25
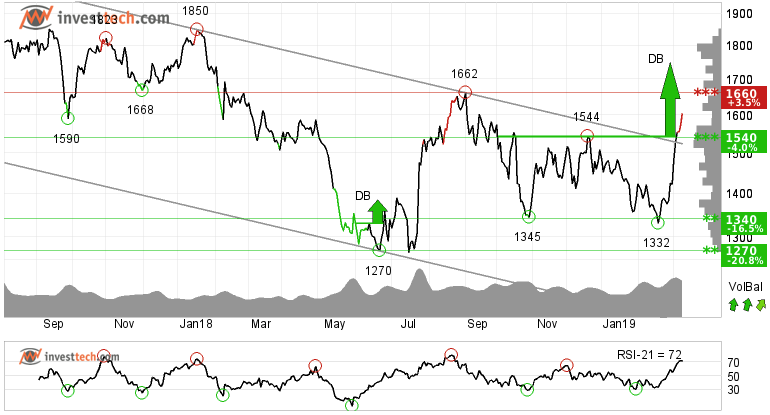
The ACC Limited stock has given a breakout through the ceiling of the falling trend channel and the double bottom formation at the same time around 1540 rupees in the medium term. There is resistance around the 1660 level in the medium term and 1730-1850 in the longer term chart. A break and close above that level may initiate fresh buying and the stock may go higher. In the short term there is support around 1513 and bigger support around 1425 rupees.
The volume balance indicator is positive and RSI is above 70. These parameters support the rise in stock price. The stock is overall assessed as technically positive for the short to medium term.
Recommendation one to six months: Positive
Ambuja Cements Limited (AMBUJACEM.NS) Close: 233.30
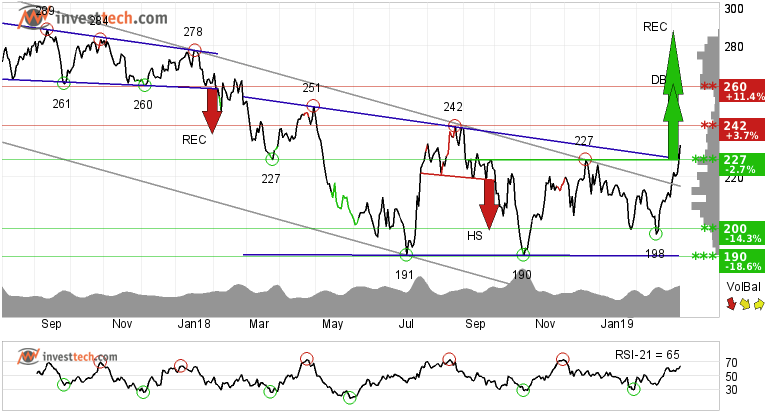
Like suggested earlier, this chart is very similar in its feel to the chart of ACC Limited in all time frames.
Support in the stock is around 227-215 rupees and resistance is at 242 and 260 levels.
Recommendation one to six months: Positive
The analyses are based on closing price as per March 11, 2019. Maintaining proper stop loss is always recommended.
Written by

Analyst - Investtech
Archive:
08 March: Clear breakout and reversal from intermediate downtrend
06 March: Three buy candidates for medium to long term
28 February: Breakout in these three stocks invites for early opportunity
26 February: Two buy opportunities for the near term future
21 February: Stocks with RSI above 70, based on our research
19 February: Close to selling point, time to be cautious
15 February: These two sugar stocks look promising
14 February: Three short to medium term opportunities
08 February: One buy and one sell in stocks while index suggests caution
06 February: One buy and one sell, short to medium term opportunities
01 February: Upside breakout from price formations
30 January: Buying opportunity: Reversing from trend channel support
9 January: One positive and one to stay away from
2 January: A good investment opportunity
2018
21 December: Good buying opportunities
14 December: Positive on these three stocks
11 December: One buy and one sell signal
07 December: Sell Signals in Three Big Stocks
04 December: Highest scorer of our Top 50 list
30 November: Positive stocks with 5-11 per cent upside potential
28 November: Buy signal on high volume
27 November: One Buy and One Sell Signal
23 November: Fear dominates these stocks
21 November: Sell signal, time to stay away
20 November: Early opportunity from short term buy signal
16 November: Two Buy Signals and One Sell Signal
15 November: Buy signal in this one
13 November: Big auto stocks comparison
09 November: What to wait for?
06 November: Banking stocks look positive
02 November: Positive on this one
01 November: TECHM, NIFTY50 and Hausse
31 October: What are investors thinking?
30 October: Bullish on these three stocks
26 October: Three potential candidates to ride on
24 October: Three big Metal stocks, Seasonal variation
22 October: Among top performers on our Top 50 list
18 October: Three stocks investors should stay away from
17 October: Flowing against the tide
16 October: Positive on these 2 stocks
11 October: Over 45 per cent rise
9 October: The Indian banking space
5 October: Nifty closes at a crucial level
2 October: Price formations in the long-term charts
28 September: Positive on Biocon Limited
"Investtech analyses the psychology of the market and gives concrete trading suggestions every day."

Partner & Senior Advisor - Investtech


Investtech guarantees neither the entirety nor accuracy of the analyses. Any consequent exposure related to the advice / signals which emerge in the analyses is completely and entirely at the investors own expense and risk. Investtech is not responsible for any loss, either directly or indirectly, which arises as a result of the use of Investtechs analyses. Details of any arising conflicts of interest will always appear in the investment recommendations. Further information about Investtechs analyses can be found here disclaimer.
The content provided by Investtech.com is NOT SEC or FSA regulated and is therefore not intended for US or UK consumers.
Copyright Ⓒ 1997-2024 Investtech.com AS, Org nr 978 655 424 MVA Privacy Policy | Conditions générales d'utilisation et avis de précaution
Head office
Strandveien 171366 Lysaker, Norway
Research department
Instituttveien 102007 Kjeller, Norway