
 Oslo Børs
 Stockholmsbörsen
 Københavns Fondsbørs
Investeringsforeninger
Københavns Fondsbørs
Investeringsforeninger
 Helsingin pörssi
 World Indices
 US Stocks
US 30
Nasdaq 100
US 500
US Stocks
US 30
Nasdaq 100
US 500
 Toronto Stock Exchange
 London Stock Exchange
 Euronext Amsterdam
 Euronext Brussel
 DAX
SDAX
TECDAX
CDAX
MDAX
Prime Standard
DAX
SDAX
TECDAX
CDAX
MDAX
Prime Standard
 CAC 40
 Mumbai S.E.
National S.E.
Mumbai S.E.
National S.E.
 Commodities
 Currency
 Cryptocurrency
 Exchange Traded Funds
 Investtech Indices
Aidos Kuneen (ADK.CPT)
Close: 0.15 (0.00), Apr 25, 2025
See Recommendation

Automatic technical analysis. Medium term, Apr 25, 2025
Aidos Kuneen has broken the falling trend channel in the medium long term and reacted strongly up. For the time being, it is difficult to say anything about the future trend direction. The moving average indicator has given a positive signal. In isolation, this signals a continued rise, but the slowness of the indicator often means that one has lost much of the upside. There is no resistance in the price chart and further rise is indicated. In case of a negative reaction, the currency has support at approximately 0.09 points. RSI above 70 shows that the currency has strong positive momentum in the short term. Investors have steadily paid more to buy the currency, which indicates increasing optimism and that the price will continue to rise. However, particularly for big stocks, high RSI may be a sign that the stock is overbought and that there is a chance of a reaction downwards.Recommendation one to six months: See Recommendation
Partners


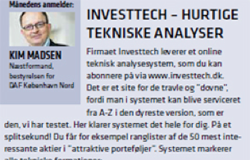
Investtech in the media
Digital Investor

Dagbladet
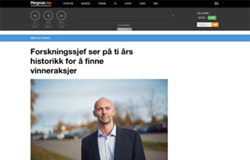
Hegnar
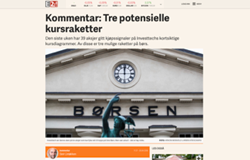
E24
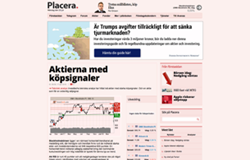
Placera
How Investtech works

Collect stock market data
Price, volume, insider information, corporate actions etc.

Perform advanced analysis
Using mathematical pattern recognition, statistical optimization and behavioural finance

Deliver actionable insights
Daily across the stocks, indices and commodities that matter most to your portfolio
Investtech by the numbers
Experience
26years
since 1997
Model portfolio
14.5%
average annual return
Analysis across
20+
stock exchanges
Recommendations of
30 000+
stocks, indices, currencies, cryptocurrencies and commodities
Investtech guarantees neither the entirety nor accuracy of the analyses. Any consequent exposure related to the advice / signals which emerge in the analyses is completely and entirely at the investors own expense and risk. Investtech is not responsible for any loss, either directly or indirectly, which arises as a result of the use of Investtechs analyses. Details of any arising conflicts of interest will always appear in the investment recommendations. Further information about Investtechs analyses can be found here disclaimer.
The content provided by Investtech.com is NOT SEC or FSA regulated and is therefore not intended for US or UK consumers.
Data: 
Investtech guarantees neither the entirety nor accuracy of the analyses. Any consequent exposure related to the advice / signals which emerge in the analyses is completely and entirely at the investors own expense and risk. Investtech is not responsible for any loss, either directly or indirectly, which arises as a result of the use of Investtechs analyses. Details of any arising conflicts of interest will always appear in the investment recommendations. Further information about Investtechs analyses can be found here disclaimer.
The content provided by Investtech.com is NOT SEC or FSA regulated and is therefore not intended for US or UK consumers.
Copyright Ⓒ 1997-2025 Investtech.com AS, Org nr 978 655 424 MVA Privacy Policy | Disclaimer | Sustainability Strategy
Head office
Strandveien 171366 Lysaker, Norway
Research department
Instituttveien 102007 Kjeller, Norway
×
