Global stocks: The big techs - Google, Apple and Microsoft
Published October 30, 2019
Markets are rejoicing as the S&P 500 index reaches its all time high. The stock market is a mirror of the economy as a whole. It shows how overall development and growth are unfolding and is a good indicator of investor sentiment. The health of the broader index, as suggested by its all time high position now, indicates that investors trust the policies of the government at large.
Also Alphabet Inc. presented its quarterly numbers. Even though the EPS figure was not very promising, down from 13.06 from last year in the same period to 10.12 in the previous quarter, the stock price does not seem to agree with it. We will have a look at the price chart of Alphabet.
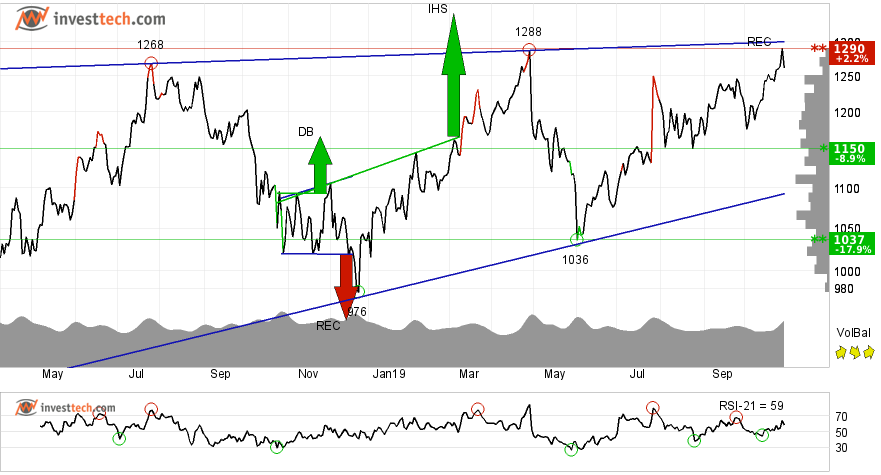
Alphabet Inc (GOOG.US500) Close: 1262.62
Alphabet Inc does not show any clear trend in the medium term but is inside a rising trend channel in the long term. The stock has been moving within a rectangle formation since mid 2017 and is trading between support at 1093 and resistance at 1301. This clearly suggests indecision among investors as the are not able to make up their minds in which direction to take the price. However, a decisive break from any of the price levels in either direction will indicate further price development in the same direction. There is support around 1245 and 1205 dollars.
Currently the price is hovering around its resistance around 1300 dollars. Momentum indicator RSI above 70 shows that the stock has strong positive momentum in the short term. Investors have steadily paid more to buy the stock, which indicates increasing optimism. The stock is overall assessed as technically weak positive and not strongly positive only because it is under its resistance.
Investtech's outlook (one to six months): Weak Positive
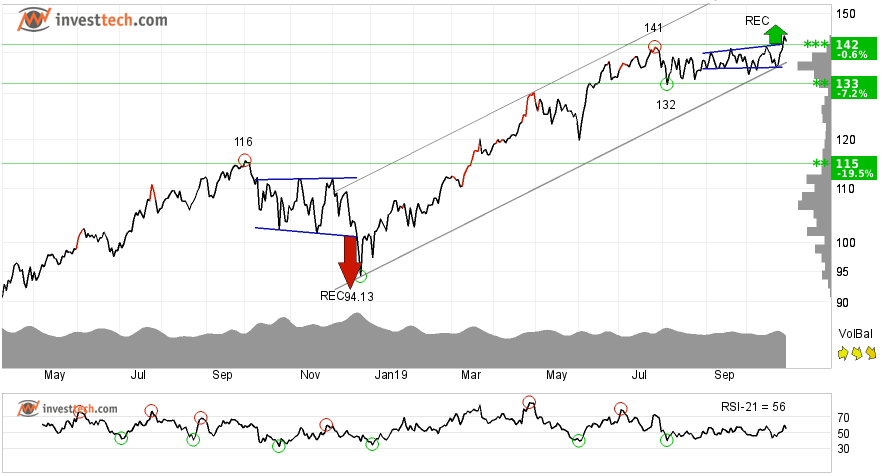
Microsoft (MSFT.US500) Close: 142.83
A sideways price movement of five months is finally broken. Microsoft Inc. has given a buy signal from a small rectangle formation in the medium term chart. Further rise to 147 or more is signalled. The stock has also broken up through resistance at 142 dollars and further rise in the stock is expected. In case of any downside reaction, there is support around 133 dollars.
In the bigger picture, Microsoft is in a rising trend channel in the medium long term. This shows that investors over time have bought the stock at higher prices and indicates good development for the company. The stock is overall assessed as technically slightly positive for the short to medium term.
Investtech's outlook (one to six months): Positive
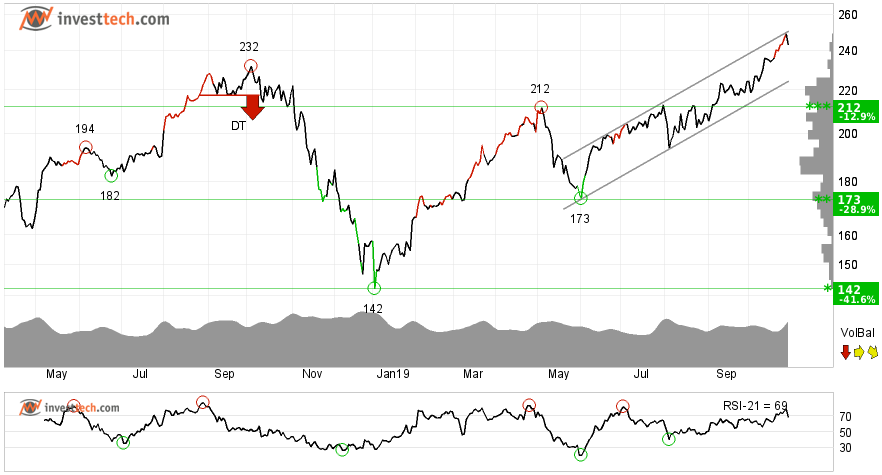
Apple (AAPL.US500) Close: 243.29
Investors have paid higher prices over time to buy Apple and the stock is in a rising trend channel in all time frames; short, medium and long term. Rising trend indicates that the company is overall achieving good and healthy growth and the investors are happy with its development. This signals increasing optimism among investors and reflects as continued rise for the stock in the near future. The stock has no clear resistance above 249 dollars, which is also its closing price on Monday. On the downside, there is support around 236 and 216 dollars in the short term.
The short term momentum of the stock is strongly positive, with RSI above 70. This indicates increasing optimism among investors and further price increase for Apple. The stock is overall assessed as technically slightly positive for the short to medium term.
Investtech's outlook (one to six months): Positive
The analyses are based on closing price as per October 29, 2019.
These instruments are traded in currency based on the Exchange or country they are listed on.
Written by

Analyst - Investtech
"Investtech analyses the psychology of the market and gives concrete trading suggestions every day."

Partner & Senior Advisor - Investtech
Investtech guarantees neither the entirety nor accuracy of the analyses. Any consequent exposure related to the advice / signals which emerge in the analyses is completely and entirely at the investors own expense and risk. Investtech is not responsible for any loss, either directly or indirectly, which arises as a result of the use of Investtechs analyses. Details of any arising conflicts of interest will always appear in the investment recommendations. Further information about Investtechs analyses can be found here disclaimer.
The content provided by Investtech.com is NOT SEC or FSA regulated and is therefore not intended for US or UK consumers.


 Oslo Børs
 Stockholmsbörsen
 Københavns Fondsbørs
 Helsingin pörssi
 World Indices
 US Stocks
 Toronto Stock Exchange
 London Stock Exchange
 Euronext Amsterdam
 Euronext Brussel
 DAX
DAX CAC 40
 Mumbai S.E.
 Commodities
 Currency
 Cryptocurrency
 Exchange Traded Funds
 Investtech Indices


