Buy signal from rising trend - an analysis (18. December 2009)
A research report from Investtech.com shows that buy signals from rising trends have given significant excess return.
Trends are one of the most important elements of technical analysis. They are visual and intuitive and describe in which direction a stock is moving. A rising trend indicates lasting and increasing optimism among investors, often as a result of a great deal of positive news about the stock.
Many investors identify trends by studying charts and drawing trend lines by hand. This method has many weaknesses, one of which is that it is subjective. You see the trends you want to see and which perhaps fit your own subconscious preferences. It is also a very time consuming method. Investtech has developed automatic algorithms for identification of trends. Every day these algorithms identify the “best” trend in the chart, on criteria such as distance between the trend’s support and resistance lines and number of data points near these lines. Roughly 80,000 various trend alternatives are assessed each day for a medium term Investtech chart with 18 months of historical data. These are given a score and the best trend is selected.
In a comprehensive research project, Senior Analyst Asbjørn Taugbøl and R&D Manager Geir Linløkken from Investtech.com looked at the stocks listed on the Oslo Stock Exchange from 1996 to 2009. The day each stock entered a rising trend was identified and defined as a buy signal. A total of 3,747 buy signals were identified. Price development in the time period following the buy signal was evaluated and compared to benchmark (OSEBX). Similarly they looked at what happens when the stock enters a falling trend, defined as a sell signal. 2,792 sell signals were identified. The trends were identified automatically and the criterion for a rising trend was a rate of increase of more than 10 degrees.
- The results are clear-cut and very interesting. Stocks with buy signals from rising trends have consistently given good results over time, with significant excess return compared to benchmark, says Mr. Taugbøl.
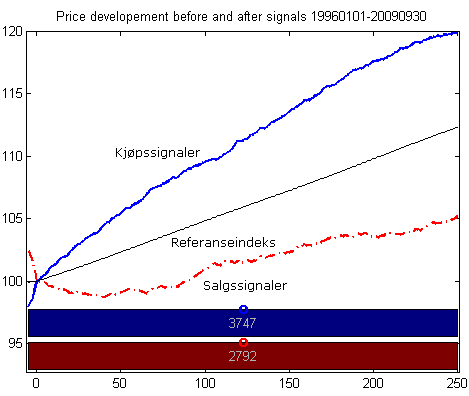
The research report from Investtech.com shows that stocks after buy signal have an average return after one month of 2.7 % and after 12 months of 20.0 %. The stock exchange average is 1.0 % and 12.3 % respectively, which means an excess return of 1.7 % and 7.7 % after 1 month and 12 months respectively. Sell signals, i.e. stocks that enter a falling trend, on average fall by 1.1 % the first month. After one year, stocks in falling trends have risen on average 5.2 %, i.e. 7.2 percentage points less than benchmark.

Figure 1: The figure shows average price development five days before signal and one year after signal for Norwegian stocks in the time period 1996-2009. The blue line is buy signals, the red line is sell signals and the black line is benchmark average price development for the period.
Mr. Taugbøl emphasises that the data set, which covers nearly fourteen years and contains both positive and negative years for the stock exchange, is considered representative for an average period of time on the stock exchange.
The same analysis was carried out for Swedish stocks, and buy signals give significant excess return and sell signals less return there as well.
Most well-functioning stock exchanges are influenced by the same mechanisms as the Norwegian and Swedish stock exchanges. Central psychological factors such as greed and fear are assumed to be the same for investors world wide. As such there is reason to believe that the overall conclusions of this report will also be valid in other markets, concludes Mr. Taugbøl.
The complete research report is available here >>
Investtech guarantees neither the entirety nor accuracy of the analyses. Any consequent exposure related to the advice / signals which emerge in the analyses is completely and entirely at the investors own expense and risk. Investtech is not responsible for any loss, either directly or indirectly, which arises as a result of the use of Investtechs analyses. Details of any arising conflicts of interest will always appear in the investment recommendations. Further information about Investtechs analyses can be found here disclaimer.
The content provided by Investtech.com is NOT SEC or FSA regulated and is therefore not intended for US or UK consumers.


 Oslo Børs
 Stockholmsbörsen
 Københavns Fondsbørs
 Helsingin pörssi
 World Indices
 US Stocks
 Toronto Stock Exchange
 London Stock Exchange
 Euronext Amsterdam
 Euronext Brussel
 DAX
DAX CAC 40
 Mumbai S.E.
 Commodities
 Currency
 Cryptocurrency
 Exchange Traded Funds
 Investtech Indices