try to get document id 48700
try to get document id 48700
try to get document id 48700
Investtech Research: Support and Resistance - Summary
Published 29 October 2019
Support and resistance are among the most important elements of technical analysis. In theory, a stock which has fallen towards support is cheap and should be bought. Stocks that have broken upwards through resistance levels are said to have triggered buy signals and should be bought. The opposite is true for stocks that have risen and are testing resistance or have broken downwards through support - these should be sold.
We have studied price movements following buy and sell signals from support and resistance levels in Investtech's price charts for the Norwegian, Swedish, Danish and Finnish Stock Exchanges in a period of 23 years, from 1996 to 2018. In some areas our findings are in accordance with the theory, while other findings indicate that the theory is weak or even wrong.
This is an overview of results and conclusions. The details are described in six articles for the individual buy and sell signals, which are based on four individual research reports.
Buy signals: Stocks that have fallen back and are near support
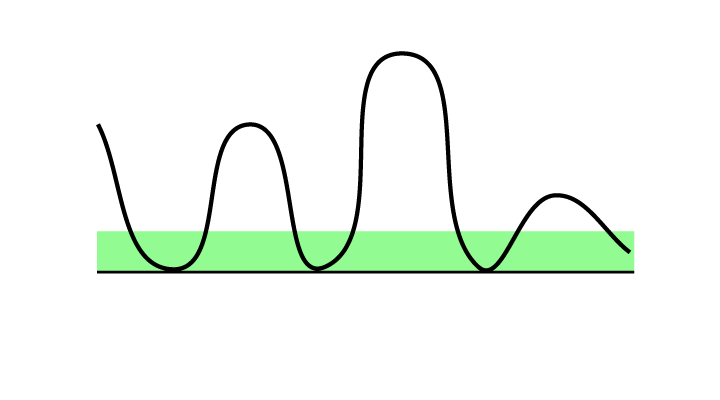 Theory: Price is near support. The stock has reversed here before. Many investors now find it to be cheap and may wish to buy again.
Price near support is an indication that the price will rise. The definition of support says that more and more buyers are active the closer the price gets to the support level. It can be favourable to set a buy order a little above the support level when wanting to buy such stocks.
Please note that a break downwards through support will trigger a sell signal. The price can potentially fall very much in a short time. It can be risky to buy on support especially if volume development is negative or the stock is in a falling trend.
Research results:
The Nordic markets 1996-2018, a total of 56,703 buy signals.
Stocks that have fallen back and are testing or are near support have on average developed in line with benchmark the following months. Annualised return has been 0.2 percentage points weaker than benchmark.
Read the research article here>>
Sell signals: Stocks that have risen and are near resistance
 Theory: Price is near resistance. The stock has reversed here before. Many investors now find it to be expensive and may wish to sell.
Price near a resistance level is an indication that the price will fall. The definition of resistance says that more and more sellers will be active the closer the price gets to the resistance level. It can be favourable to place a sell order a little below the resistance level when wanting to sell such stocks.
Please note that a break upwards through resistance will trigger a buy signal. The price can potentially rise very much in a short time. Especially in the case of positive volume development or stocks in a rising trend, it can be a good idea to wait and not sell on resistance.
Research results:
The Nordic markets 1996-2018, a total of 63,954 sell signals.
Stocks that have risen and are testing or are near resistance have on average developed in line with or a little stronger than benchmark in the following months. Annualised return has been 1.9 percentage points better than benchmark.
Read the research article here>>
Buy signals: Stocks that have broken upwards through resistance
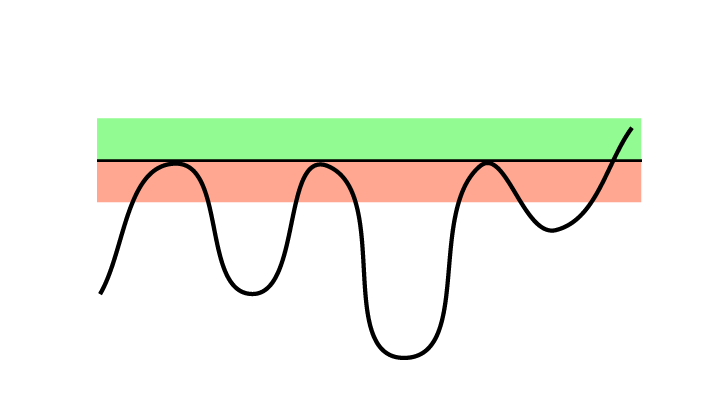 Theory: A break upwards through resistance is a buy signal. This is especially true if volume is also increasing. The sellers who used to be at this level are gone, but there is still buy pressure in the stock.
A stock that recently broke through a resistance level is expected to continue rising. Buying such stocks allows the investor to enter the stock early in a rising phase. If the stock has risen significantly since the break, a better price can be achieved by waiting for a reaction back.
Please note that stocks in falling trends often give false buy signals on breaks upwards through resistance. When buying such stocks, a long term and strong resistance level should be broken, and the break should be accompanied by increasing volume and positive volume development.
Research results:
The Nordic markets 1996-2018, a total of 43,367 buy signals.
Stocks with buy signal after break upwards through resistance have on average continued to rise and risen more than benchmark in the following months. Annualised return has been 5.1 percentage points better than benchmark.
Read the research article here>>
Sell signals: Stocks that have broken downwards through support
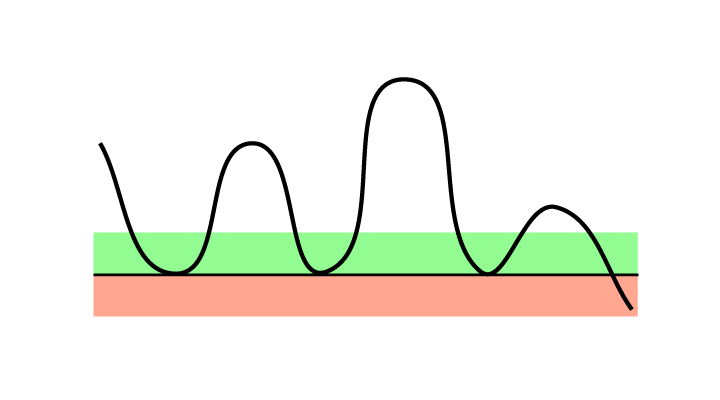 Theory: A break downwards through support is a sell signal. Especially if volume is also increasing. The buyers who used to be at this level are gone, but there is still sales pressure in the stock.
A stock that recently broke downwards through a support level is expected to continue to fall. Selling or not buying such stocks help the investor avoid the continued fall. If the stock has fallen significantly since the break, a better price can be achieved by waiting for a reaction back.
Please note that stocks in rising trends often trigger false sell signals on breaks downwards through support. Investors who own such stocks should normally see a break downwards through a long term, strong support level, preferably on high volume, before selling.
Research results:
The Nordic markets 1996-2018, a total of 38,693 sell signals.
Stocks with sell signals after breaks downwards through support have on average risen in the following period, but much less than benchmark in the same period. Annualised return has been 2.7 percentage points weaker than benchmark.
Read the research article here>>
Buy signals: Stocks that are above support and lack resistance
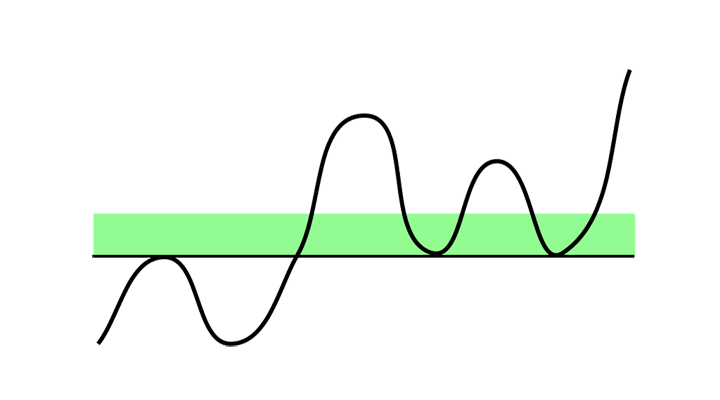 Theory: The price is above a support level, where the stock has previously turned upwards. Many investors may consider it cheap if it falls towards support again, and may then wish to buy.
Support is where many buyers are thought to become active. It is normally assumed that the stock will not fall below support. A stock with a long way down to support has a bigger downside than a stock near support.
Especially in rising and horizontal trends, support expresses the downside potential in the stock. If, at the same time, there is little to no resistance above the current price, the upside potential tends to be high.
Research results:
The Nordic markets 1996-2018, a total of 44,463 buy signals.
Stocks with buy signal from being above support and lacking resistance have on average risen in the following period. Annualised return has been 12.0 percentage points better than benchmark.
Read the research article here>>
Sell signals: Stocks that are below resistance and lack support
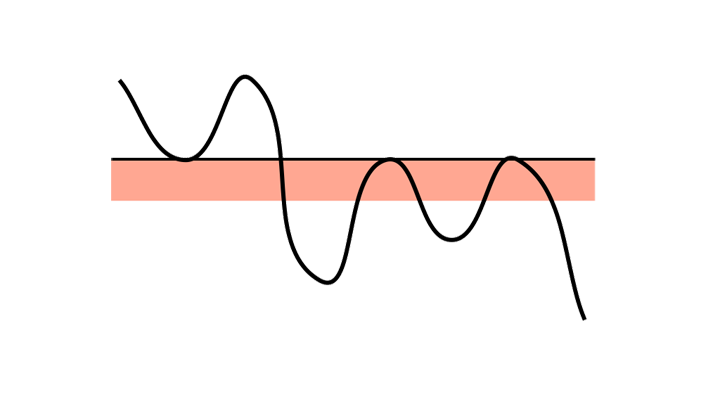 Theory: The price is below a resistance level, where the stock has previously turned downwards. Many investors may consider it expensive if it rises up to resistance, and may then wish to sell.
Resistance is a level where many sellers are thought to become active. It is normally assumed that the stock will not rise above the resistance level. Resistance is thus often used to calculate the upside potential of a stock, especially for short term investors. A stock with a long way up to resistance has a bigger upside potential than a stock near resistance.
Especially in falling and horizontal trends, resistance expresses the upside potential in the stock. If, at the same time, there is little to no support below the current price, the downside potential tends to be big.
Research results:
The Nordic markets 1996-2018, a total of 19,586 sell signals.
Stocks with sell signal from being below resistance and lacking support have on average fallen in the following period. Annualised return has been 7.6 percentage points weaker than benchmark.
Read the research article here>>
Conclusions
Based on the above we come to the following conclusions:
Conclusion 1:
Stocks that have had a negative reaction and are testing support (buy signal) or that have had a positive reaction and are testing resistance (sell signal) overall developed in line with benchmark in the following period. These signals give little information about future price development and can be dropped from a technical analysis of a stock without any significant loss. These research results call into question an important element of classic technical analysis theory.
Conclusion 2:
Stocks that have broken upwards through resistance (buy signal), have continued to rise, and they have risen more than general market development. Stocks that have broken downwards through support (sell signal) have continued to underperform. These signals can be valuable in a decision of whether to buy or sell a stock. The period after a break upwards through resistance will statistically be a good time to buy. This aligns with classic technical analysis theory.
Conclusion 3:
Stocks that are far above support and without any resistance, have risen well in the coming period. Similarly, stocks far below resistance and without any support, have underperformed. Despite these being considered neutral situations in theory, the research results show that they are statistically very strong signals.
All results appear consistent over time and they were strong whether identified in Investtech's short, medium or long term price charts. The results were consistent across all four markets. In general, the effects were stronger for smaller companies than bigger ones.
The time period for the study is fairly long, the quality of the data is considered to be good and the algorithms used are entirely automatic and deemed to identify support and resistance in a good way. The data set is large and the conclusions are considered robust.
Read more in the research report here.
Keywords: h_ResBroken,h_SupBroken.
Skrevet av

Forsknings- og analysesjef
i Investtech
Research articles:
Support and Resistance: Research results cause doubt about buy signals
Support and Resistance: Profitable to buy stocks that are near resistance
Support and Resistance: Break upwards through resistance is a buy signal
Support and Resistance: Break downwards through support is a sell signal
Support and Resistance: Buy signal when stock is above support and lacks resistance
Support and Resistance: Good sell signals from stocks that are far below resistance and lack support
Please note:
Changes to Support and Resistance algorithms
Insight & Skills:
"Investtech analyserer psykologien i markedet og gir deg konkrete tradingforslag hver dag."

Partner & Senior Advisor - Investtech
Investeringsanbefalingen(e) er utarbeidet av Investtech.com AS ("Investtech"). Investtech garanterer ikke fullstendigheten eller riktigheten av analysen. Eventuell eksponering i henhold til rådene / signalene som fremkommer i analysene står fullt og helt for investors regning og risiko. Investtech er ikke ansvarlig for noe tap, verken direkte eller indirekte, som oppstår som en følge av bruk av Investtechs analyser. Opplysninger om eventuelle interessekonflikter vil alltid fremgå av investeringsanbefalingen. Ytterligere informasjon om Investtechs analyser finnes på informasjonssiden.
Investeringsanbefalingen(e) er utarbeidet av Investtech.com AS ("Investtech"). Investtech garanterer ikke fullstendigheten eller riktigheten av analysen. Eventuell eksponering i henhold til rådene / signalene som fremkommer i analysene står fullt og helt for investors regning og risiko. Investtech er ikke ansvarlig for noe tap, verken direkte eller indirekte, som oppstår som en følge av bruk av Investtechs analyser. Opplysninger om eventuelle interessekonflikter vil alltid fremgå av investeringsanbefalingen. Ytterligere informasjon om Investtechs analyser finnes på informasjonssiden.


 Oslo Børs
 Stockholmsbörsen
 Københavns Fondsbørs
 Helsingin pörssi
 World Indices
 US Stocks
 Toronto Stock Exchange
 London Stock Exchange
 Euronext Amsterdam
 Euronext Brussel
 DAX
DAX CAC 40
 Mumbai S.E.
 Commodities
 Currency
 Cryptocurrency
 Exchange Traded Funds
 Investtech Indices


