Analysis News

  • Marknadens bästa nyhetsbrev
  • Anpassat efter dina behov
  • Gratis på e-post var dag innan börsöppning

Receive Analysis News:

E-mail:

Free daily newsletter every morning

Content
Signaux
Tous les indices - Moyen terme
OMX Stockholm Benchmar24. avr 2025
OMX Stockholm 60 Cap P24. avr 2025
Assa Abloy B24. avr 2025
EQT24. avr 2025
Kurser & event 2025
  • Måndagar kl. 08.30 Veckans aktietips Sverige
  • Tisdagar kl. 08.30 Ugens aktietips Danmark
  • Fredagar kl. 08.30 Ukens aksjetips Norge
  •    

    The market showed a small gain jeudi, and OMX Stockholm PI (OMXSPI) ended the day at 916 points, which is an increase of 0.3 percent.

    462 shares showed a gain and 443 showed a loss. 65 shares were unchanged and closed at the same price as the previous day. There was no trading in 60 shares.

    Total value of the trading volume for shares and primary capital certificates jeudi was approximately 21.7 billion.

    AAK (AAK) was down 6.5 percent to close at 255 kronor. We must go back to avril 2024 to find a lower close for l'action. It was also high volume. Overall it was traded for 289 millions kronor in l'action, which is three times as much as normal daily turnover. It does not look good technically either. L'action is trend wise negative in the medium term, has resistance at 276 kronor and a further decline is indicated.
    AFRY (AFRY) closed at 160 kronor after a steep drop of 14.4 percent. We must go back to mai 5. 1999 to find an equally steep drop. That time l'action lost 15.0 percent. The volume was also high. At session end it was bought and sold shares for about 196 million kronor in l'action, which equals eight times mean daily turnover. It does not look good technically either. L'action est considéré comme negatif technique pour moyen long terme.
    Vitrolife (VITR) closed down 7.6 percent to 145 kronor. L'action has not closed lower since novembre 2023. The volume was also high. At session end it was bought and sold shares for about 167 million kronor in l'action, which equals seven times mean daily turnover. Nor technically does it look good. L'action is trend wise negative in the medium term, has resistance at 165 kronor and a further decline is indicated.
    Mips AB (MIPS) closed at 335 kronor after posting a loss of 7.7 percent. The previous time l'action lost this much was octobre 26. 2023, when it closed down 8.5 percent. It was also high volume. Overall it was traded for 151 millions kronor in l'action, which is seven times as much as normal daily turnover. Nor technically does it look good. L'action is trend wise negative in the medium term and a further decline is indicated.
    Lundin Gold (LUG) showed a small gain and ended the day at 398 kronor, which is an increase of 1.4 percent. L'action has thereby closed up ten out of the past 11 days and this past month l'action has gained as much as 32.3 percent. Technically it also looks good. L'action is trend wise positive in the medium term, has support at 277 kronor and a further increase is indicated.

    US 500 sharply higher
    The market rallied jeudi, and S&P 500 (SP500) closed at 5485 points after an increase of 2.0 percent. This past week l'indice has gained as much as 4.0 percent.

    Indices
    OMX Stockholm PI
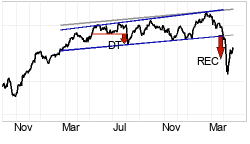
    arrow red   Candidat négatif intéressant
    Un canal horizontal est franchi ā la baisse. Un développement faible est indiqué, et en cas de rebondissements OMX Stockholm PI rencontre maintenant une résistance vers le plancher du canal horizontal. La valeur a atteint l'objectif ā 874 aprčs le franchissement d'une formation rectangulaire. Le cours a rebondi depuis, mais la formation indique une poursuite de la baisse. L'indice rencontre du support ā environ 754 points et de la résistance ā environ 1015 points. L'indice est généralement considéré comme negatif technique pour moyen long terme.
    S&P 500
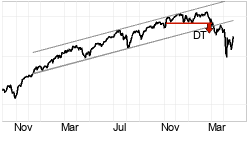
    arrow green   Candidat positif intéressant
    S&P 500 a débordé le plancher du canal haussier, ce qui dans un premier temps, indique un taux de croissance plus faible. Le titre a franchi un niveau de résistance sur le court terme et la stratégie de trading range court terme a donné un signal d'achat. L'indice rencontre du support ā environ 5200 points et de la résistance ā environ 5820 points. L'indice est généralement considéré comme positif technique pour moyen long terme.
    Cas du jour
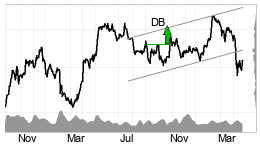
    Nolato B (NOLAB) Cours 51.90, 24. avr 2025
    chart
    Nolato B a débordé le plancher du canal haussier, ce qui dans un premier temps, indique un taux de croissance plus faible. Le titre a franchi un niveau de résistance sur le court terme et la stratégie de trading range court terme a donné un signal d'achat. L'action a franchi la résistance ā environ 51.00 kronor et une poursuite de la hausse est annoncée. L'action est généralement considéré comme positif technique pour moyen long terme.
    Recommendation: Positif
    Index du jour précédent
    AEX0.27%871.99
    CAC400.27%7502.78
    COMPX2.74%17166.00
    DAX0.47%22065
    HEX-0.83%9701.34
    N1000.29%1491.51
    OMXC25GI-0.45%1892.93
    OMXSPI0.29%915.92
    OSEBX0.29%1456.43
    PSI200.61%6878.47
    TECDAX1.17%3583.19
    BUK100P0.10%837.40
    EURUSD0.16%1.1400
    CL (OIL)0.84%62.79
    Estimations d'index
     CML
    AEXnegpospos
    CAC40negpospos
    COMPXnegpospos
    DAXnegpospos
    HEXnegneutralneg
    N100neutralpospos
    OMXC25GInegnegpos
    OMXSPInegnegpos
    OSEBXnegnegneutral
    PSI20neutralpospos
    TECDAXnegpospos
    BUK100Pnegneutralpos
    EURUSDpospospos
    CL (OIL)negnegneg

    C: Court terme.    M: Moyen terme.    L: Long terme .
    Baromčtre de bourse
    Stockholmsbörsen - Moyen terme
     
          
    23% 45% 32%
     247 Candidats positifs intéressants
     487 A surveiller
     341 Candidats négatifs intéressants
    Track what the insiders are doing! Insider buys in green, insider sales in red.
     
       Mois dernier:
       76% Positif
       302 Positif
       94 Négatif
    Conditions générales d'utilisation et avis de précaution Copyright © 2025 Investtech.com AS, Org nr 978 655 424 MVA


    Investtech guarantees neither the entirety nor accuracy of the analyses. Any consequent exposure related to the advice / signals which emerge in the analyses is completely and entirely at the investors own expense and risk. Investtech is not responsible for any loss, either directly or indirectly, which arises as a result of the use of Investtechs analyses. Details of any arising conflicts of interest will always appear in the investment recommendations. Further information about Investtechs analyses can be found here disclaimer. The content provided by Investtech.com is NOT SEC or FSA regulated and is therefore not intended for US or UK consumers.

    Cancel Analysis News
    [ Back to default newsletter setup ]

    Edit AnalysisNews

    Register as a recipient of AnalysisNews in order to customise the content.


    Investtech guarantees neither the entirety nor accuracy of the analyses. Any consequent exposure related to the advice / signals which emerge in the analyses is completely and entirely at the investors own expense and risk. Investtech is not responsible for any loss, either directly or indirectly, which arises as a result of the use of Investtechs analyses. Details of any arising conflicts of interest will always appear in the investment recommendations. Further information about Investtechs analyses can be found here disclaimer. The content provided by Investtech.com is NOT SEC or FSA regulated and is therefore not intended for US or UK consumers.


    Investtech guarantees neither the entirety nor accuracy of the analyses. Any consequent exposure related to the advice / signals which emerge in the analyses is completely and entirely at the investors own expense and risk. Investtech is not responsible for any loss, either directly or indirectly, which arises as a result of the use of Investtechs analyses. Details of any arising conflicts of interest will always appear in the investment recommendations. Further information about Investtechs analyses can be found here disclaimer. The content provided by Investtech.com is NOT SEC or FSA regulated and is therefore not intended for US or UK consumers.

    Titlex

    OK
    +

    Om cookies

    Investtech använder cookies. Genom att fortsätta surfa på webbplatsen accepterar du vår användning av cookies. Läs mer om cookies.