
 Oslo Børs
 Stockholmsbörsen
 Københavns Fondsbørs
Investeringsforeninger
Københavns Fondsbørs
Investeringsforeninger
 Helsingin pörssi
 World Indices
 US Stocks
US 30
Nasdaq 100
US 500
US Stocks
US 30
Nasdaq 100
US 500
 Toronto Stock Exchange
 London Stock Exchange
 Euronext Amsterdam
 Euronext Brussel
 DAX
SDAX
TECDAX
Frankfurt
CDAX
MDAX
Prime Standard
DAX
SDAX
TECDAX
Frankfurt
CDAX
MDAX
Prime Standard
 CAC 40
 Mumbai S.E.
National S.E.
Mumbai S.E.
National S.E.
 Commodities
 Currency
 Cryptocurrency
 Exchange Traded Funds
 Investtech Indices
Investtech Indices
Is it true that smaller companies over time outperform the big ones? How dangerous are the so-called lottery stocks? Which do better - stocks that have fallen and therefore look cheap, or stocks that have risen and are in rising trends?
These are questions we attempt to answer with Investtech's new tool: Investtech Indices
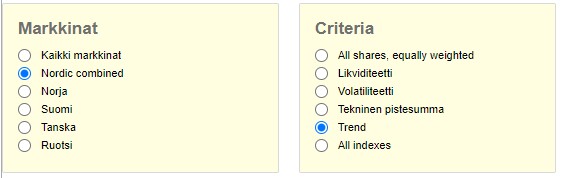
Investtech Indices are a collection of indices showing important drivers in the stock market. They show how stocks with different levels of liquidity, volatility and technical score have developed over time.
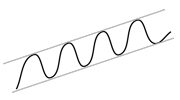
For instance, Investtech Indices show how stocks with buy and sell signals from trends have developed over time. A direct observation is that buying a portfolio of all stocks in rising trends, with stocks replaced monthly, have clearly overperformed vs an equivalent portfolio of stocks in falling trends.
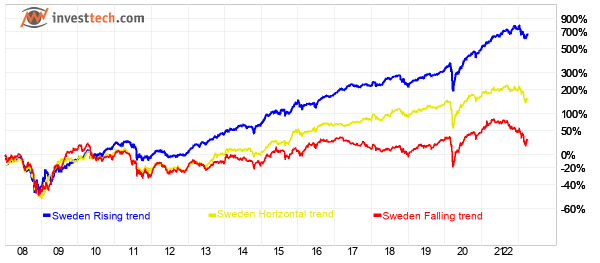
Figure: Development for Swedish stocks in falling, horizontal and rising trend channels in the period 2020 to 2022. It clearly shows that the group of stocks in falling trends have significantly underperformed compared to the others.
Stock market preferences change over time. Sometimes investors seek high return, something they look for low downside. Sometimes reversal candidates rise the most, and other times these same stocks fall the most. By looking at correlations between stock characteristics and pay off, daily, weekly or monthly, Investtech Indices can indicate which characteristics give the best return right now, and how stocks with different characteristcs have performed relative to each other.
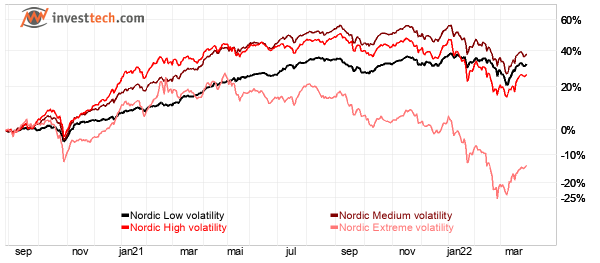
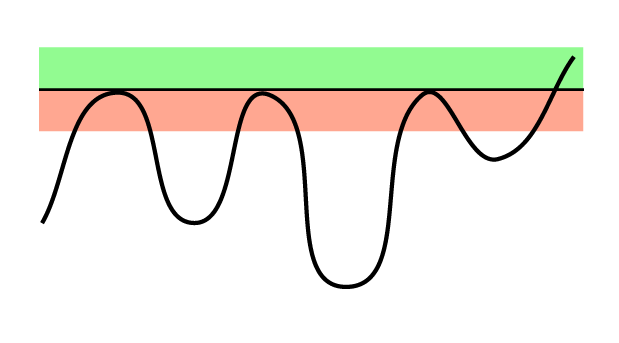
Figure: Development of Nordic stocks with different volatility in the period September 2020 to March 2022. It is clear that the group of extremely volatile stocks have significantly undeperformed compared to the others.
Long and short term price development is shown, along with historical return figures, and indices can be compared to each other. The tool is available to all subscribers on the Nordic markets. Trader level subscriptions and higher also give an overview of the which stocks are currently included in each index.
The indices cover Norway, Sweden, Denmark and Finland, and the Nordic markets combined. The calculation is balanced so that each stock in an index has the same weight, regardless of the size of the company.
In addition to factor indices, there are overreaching country indices, containing all stocks of sufficient liquidity. These will be a more fair basis of comparison for a portfolios return than stock market benchmark for small investors who invest about the same amount in each stock they own.
Technical conditions
- Updated daily, in the early morning, after all Nordic markets are updated.
- Minimum liquidity requirement for included stocks is 0.5 million NOK and 0.05 million EUR on average per day.
- Balanced calculation, so that for instance Ericsson, Novo Nordisk, Equinor, Kitron, Per Arsleff, Poolia and Kojamo all count the same in the total Nordic index, even though e.g. Novo Nordisk has a market value a thousand times that of Poolia.
- Re-weighting is done quartery, monthly or weekly. Stocks no longer meeting the index critetria are removed and new stocks may be included. Re-weighting is done again, so that a stock that for instance doubled last period and thus weighed double, is set to the same weight as all the others.
- Re-weighting intervals:
- Overall market indices: Quarterly
- Liquidity and volatility indices: Quarterly
- Technical score indices: Weekly
- Trend indices: Monthly
- Calculation parameters for the criteria:
- Liquidity: 22 day average.
- Volatility: annualised based on standard deviation last 66 days, normalised for categorization low, medium, high, extreme.
- Technical score: Medium term, set when re-weighting.
- Trend: Medium term, set when re-weighting.
- Volume shown below the charts and daily, weekly, monthly and quarterly liquidity shown on the chart page are the number of stocks that make up the index. This will be quite stable over time for market indices and the liqudity and volume based indices, while it will vary more for indices based on technical conditions.
Robustness calculation
Which stocks make up the various indices are determined at regular time intervals. The number of stocks in the different indices can therefore vary over time. If there are few stocks in an index, company specific events in the underlying stocks will influence index development to a larger extent than if there are many stocks in the index. Thus indices with many elements will be considered more reliable than indices with few elements.
We have developed a quality measurement for index robustness over time. Indices with many elements score higher and indices with fewer elements score lower. The longer the time periode with few elements, the lower the score.
Indices that continuously have more than 20 elements, get the max score. If number of elements is fewer than 20, the score will be lower the fewer elements are included and the longer the period of few elements is.
Availability
Investtech Indices are available for all subscribers on the Nordic markets. Trader level or higher subscriptions also give access to an overview of which stocks make up the indices at any time.

Investtech guarantees neither the entirety nor accuracy of the analyses. Any consequent exposure related to the advice / signals which emerge in the analyses is completely and entirely at the investors own expense and risk. Investtech is not responsible for any loss, either directly or indirectly, which arises as a result of the use of Investtechs analyses. Details of any arising conflicts of interest will always appear in the investment recommendations. Further information about Investtechs analyses can be found here disclaimer.
The content provided by Investtech.com is NOT SEC or FSA regulated and is therefore not intended for US or UK consumers.
Copyright Ⓒ 1997-2024 Investtech.com AS, Org nr 978 655 424 MVA Privacy Policy | Conditions générales d'utilisation et avis de précaution
Head office
Strandveien 171366 Lysaker, Norway
Research department
Instituttveien 102007 Kjeller, Norway