
 Oslo Børs
 Stockholmsbörsen
 Københavns Fondsbørs
Investeringsforeninger
Københavns Fondsbørs
Investeringsforeninger
 Helsingin pörssi
 World Indices
 US Stocks
US 30
Nasdaq 100
US 500
US Stocks
US 30
Nasdaq 100
US 500
 Toronto Stock Exchange
 London Stock Exchange
 Euronext Amsterdam
 Euronext Brussel
 DAX
SDAX
TECDAX
Frankfurt
CDAX
MDAX
Prime Standard
DAX
SDAX
TECDAX
Frankfurt
CDAX
MDAX
Prime Standard
 CAC 40
 Mumbai S.E.
National S.E.
Mumbai S.E.
National S.E.
 Commodities
 Currency
 Cryptocurrency
 Exchange Traded Funds
 Investtech Indices
The Trend Bible
 Telefon 08-517 295 55
 Mejla oss
 Bli uppringd
 Besök oss
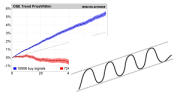
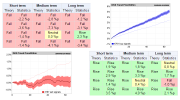
Stocks with buy signals from rising trends have given the best return in the first one to two months after signals. Return remains good, also compared to benchmark, for about six months after the signals were triggered.
Research Results Signal Power over Time
How long is a sell signal valid for? Will excess return come in the first week or month after the signal was triggered, or will such stocks still outperform benchmark half a year later?
a) Norway.
b) Sweden.
c) Denmark.
d) Finland.
Figure 1: Medium long term signals, price development the following year. Average price development for stocks in rising and falling trends in Investtechs medium long term technical charts.
| Return per day, for different time periods following signal | |||||||||||||||
| Day | -22 | -10 | -1 | 0 | 1 | 5 | 10 | 22 | 35 | 50 | 66 | 100 | 150 | 200 | 250 |
| Buy signals | 0.16 | 0.20 | 0.39 | 0.06 | 0.08 | 0.08 | 0.08 | 0.08 | 0.07 | 0.07 | 0.06 | 0.06 | 0.06 | 0.05 | |
| Sell signals | -0.22 | -0.24 | -0.39 | -0.05 | 0.00 | -0.01 | -0.01 | 0.01 | 0.00 | 0.01 | 0.01 | 0.01 | 0.01 | 0.03 | |
| Benchmark | 0.05 | 0.05 | 0.05 | 0.05 | 0.05 | 0.05 | 0.05 | 0.05 | 0.05 | 0.05 | 0.06 | 0.06 | 0.06 | 0.06 | |
The table shows average return per day after signals for stocks that on day 0 (the day signal was triggered) were in rising and falling trends in Investtechs medium long term technical charts. The figures are estimated as a weighted average of the four Nordic stock exchanges shown in the charts above.
We focus on rising trends and buy signals. The table shows that return from day -1 to day 0, i.e. the day the stock entered a rising trend*, was 0.39 per cent. In other words, there was a big rise that day, compared to average changes for the stock. The day after the signal, the stock rose by an average of 0.06 per cent. Until 35 days after the signal, the stocks rose by 0.08 per cent per day on average. After that, they rose by 0.07 per cent per day until day 66, for approximately 3 months, and then by 0.06 per cent per day until day 200.
The table and the charts show that stocks rise a little more in the first one to two months after signal, but that the rise continues for as much as a year after signal. Compared to benchmark, stocks with buy signals have given excess return for about six months.
Sell signals have given negative excess return vs. benchmark for the entire 12 month period for which we have statistics. Daily negative excess return is greater the first month, but high for all of the 200 days after signal.
We have studied predictive power over time following signals from stocks in rising trends in the medium long term. A visual inspection of return charts for other signals and from charts on other time perspectives show similar results. An overall conclusion can be that signals appear to have good predictive power the first three to six months.
*Including both the very first day a stock enters a rising trend, but also new signals after 21 days or more, if the stock remains in the same rising trend. Stocks that exited and re-entered the trend, required at least a 21 day break for a new buy signal to be registered for the same stock.
Investtechs forskningsarbete baseras på studier av mer än 350.000 signaler från trender
i börsnoterade nordiska aktier från 1996 till 2015.
Praktisk användning - Verktyg - Statistik - Algoritmer - Teori
Trendbibeln - startsida Mer om Investtechs forskning

Trendbibeln är skriven av forskningschef Geir Linløkken under 2016. Forskningsteamet bakom Trendbibeln består av seniorforskarna Asbjørn Taugbøl och Fredrik Tyvand, samt Linløkken själv.
Investtech har arbetat med forskning inom behavioural finance, teknisk och kvantitativ aktieanalys sedan 1997. Företaget har utvecklat ett analyssystem som bland annat identifierar trender, stöd och motstånd, formationer och volymmönster i aktiekurser, och ger köp- och sälj-rekommendationer baserat på detta. Investtech gör omfattande användning av avancerade matematiska algoritmer och tunga statistiska metoder i sina dataprogram och internetbaserade abonnemangstjänster.
Investtech guarantees neither the entirety nor accuracy of the analyses. Any consequent exposure related to the advice / signals which emerge in the analyses is completely and entirely at the investors own expense and risk. Investtech is not responsible for any loss, either directly or indirectly, which arises as a result of the use of Investtechs analyses. Details of any arising conflicts of interest will always appear in the investment recommendations. Further information about Investtechs analyses can be found here disclaimer.
The content provided by Investtech.com is NOT SEC or FSA regulated and is therefore not intended for US or UK consumers.
Copyright Ⓒ 1997-2024 Investtech.com AS, Org nr 978 655 424 MVA Privacy Policy | Conditions générales d'utilisation et avis de précaution
Head office
Strandveien 171366 Lysaker, Norway
Research department
Instituttveien 102007 Kjeller, Norway