
 Oslo Børs
 Stockholmsbörsen
 Københavns Fondsbørs
Investeringsforeninger
Københavns Fondsbørs
Investeringsforeninger
 Helsingin pörssi
 World Indices
 US Stocks
US 30
Nasdaq 100
US 500
US Stocks
US 30
Nasdaq 100
US 500
 Toronto Stock Exchange
 London Stock Exchange
 Euronext Amsterdam
 Euronext Brussel
 DAX
SDAX
TECDAX
Frankfurt
CDAX
MDAX
Prime Standard
DAX
SDAX
TECDAX
Frankfurt
CDAX
MDAX
Prime Standard
 CAC 40
 Mumbai S.E.
National S.E.
Mumbai S.E.
National S.E.
 Commodities
 Currency
 Cryptocurrency
 Exchange Traded Funds
 Investtech Indices
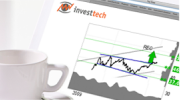
Buy signal after false sell signal
A buy signal following a false sell signal is often a very strong signal. It indicates that investors are becoming positive. A further rise is indicated, while its a short drop down to resistance level.
Theory: A sell signal from a price formation is triggered when an important support level is broken. The psychology of the market players and the company's position in its business cycle then predict that the price will drop further. Many investors will sell. If the price does not fall down to the price target of the formation, but instead rises, this often indicates that new and positive information has become available, and that new investors are buying. The sell signal was false. There are few things as irritating as a stock one just has sold rising strongly. But the stock is now more expensive than when one sold, so most of those who sold on the break down, will not do anything now. The stock continues to rise and breaks up on the opposite side of the formation. Sellers at the resistance level of the formation are gone now, there is a lack of sellers and a buy signal has been triggered. What is special about this situation is that the sellers below the floor of the formation are gone too, so that there will be an even greater imbalance between buyers and sellers than with a normal buy signal. A further rise is indicated, and one has the possibility to set a tight stop loss right below the ceiling of the formation.
Another way this can be explained is that the news surrounding the company became negative, or less positive than earlier, at the break down through the formation. Many sell based on this fundamental information. However, this turned out to be wrong, because the news turn positive again and the price rises. What seemed so negative was not so negative after all, and new positive impulses have come. The price breaks upward through the formation resistance, and sellers below the floor of the formation and sellers at the resistance are both gone. A powerful buy signal has been triggered, and a further rise is indicated.
Score: The most important criteria for calculating score for this type of trading opportunity are whether the break up happens relatively quickly after the break down, whether the volume development is positive and whether the price is near the support in the ceiling of the formation. In addition, the quality of the formation and the direction of the trend are taken into account.
Buying price: The ceiling of the formation is calculated as the line between the tops in the two shoulders in a head-and-shoulder formation, as the line between the two tops in a double-top formation and as the resistance line in a rectangle formation. A buy signal is given when this ceiling is broken, and the buying price is set from the ceiling and a little up (about 20 % of the height of the formation).
Price target: Is set to 90-125 % of the price target from the formation break.
Stop loss: Is set to 20 % of the formation's heigth under the ceiling of the formation.
Time horizon: From 40 % to 80 % of the formation's length.

Investtech guarantees neither the entirety nor accuracy of the analyses. Any consequent exposure related to the advice / signals which emerge in the analyses is completely and entirely at the investors own expense and risk. Investtech is not responsible for any loss, either directly or indirectly, which arises as a result of the use of Investtechs analyses. Details of any arising conflicts of interest will always appear in the investment recommendations. Further information about Investtechs analyses can be found here disclaimer.
The content provided by Investtech.com is NOT SEC or FSA regulated and is therefore not intended for US or UK consumers.
Head office
Strandveien 171366 Lysaker, Norway
Research department
Instituttveien 102007 Kjeller, Norway