
 Oslo Børs
 Stockholmsbörsen
 Københavns Fondsbørs
Investeringsforeninger
Københavns Fondsbørs
Investeringsforeninger
 Helsingin pörssi
 World Indices
 US Stocks
US 30
Nasdaq 100
US 500
US Stocks
US 30
Nasdaq 100
US 500
 Toronto Stock Exchange
 London Stock Exchange
 Euronext Amsterdam
 Euronext Brussel
 DAX
SDAX
TECDAX
Frankfurt
CDAX
MDAX
Prime Standard
DAX
SDAX
TECDAX
Frankfurt
CDAX
MDAX
Prime Standard
 CAC 40
 Mumbai S.E.
National S.E.
Mumbai S.E.
National S.E.
 Commodities
 Currency
 Cryptocurrency
 Exchange Traded Funds
 Investtech Indices
Tools
Top50
Top50 shows the best stocks based on Investtechs quantitative analysis system. These stocks will rise in the next weeks or months, according to investor psychology.
Investtech calculates a technical score for each stock based on analysis of the price chart. The most important contribution to this score comes from trend. Other important elements are support and resistance, price formations and volume development. The technical score will be between 100 for the most negative stocks and +100 for the most positive stocks. A score above 50 indicates a buy recommendation, between 25 and 50 is weak buy, and -25 to +25 is watch.
Top50 are the stocks with the highest technical score.
Note that often there is little that distinguishes between a stock with a score of 80 and one with a score of 70. Consequently it is of little importance whether a stock is in first or twentieth place, if they both have a relatively high score. In these situations other risk aspects such as liquidity, volatility and your own portfolio strategies, should be emphasized instead.

In the table header you can choose between Buy Candidates and Sell Candidates. You can also choose between Short term, Medium term, Long term and Overall, depending on what is included in your subscription. Short term requires a Trader subscription, while Overall requires a Professional subscription.
Model Portfolio
Facts
- The portfolio is a fictitious portfolio with no actual stock exchange investments.
- Updates are done once a week before the exchange opens. Trades are made on the previous day's closing price.
- Each stock has the same weight and they are rebalanced every day.
- The Portfolio return is updated every night.
- There is a commission of 0.2 % at each trade. No commission is estimated when rebalancing the portfolio.
- The Portfolio Manager is R&D Manager Geir Linløkken.
- The character # is used to indicate that Investtech Invest or related parties own stocks in the company.
- For further information see Investtech's Portfolio Rules.
Key Information about the Model Portfolio
- Good historical return in the long term.
- Risk in line with the exchange and good sector dispersion.
- Medium term holding time, often one to six months per stock.
- Consists of stocks that are technically positive.
- Keep good investments for a long time, sell quickly when losing.
- Active stock picking.
- Good source of inspiration for long term investors who have a moderate risk profile for their investments.
Stock Selection
Stock selection is the best stock picking tool Investtech offers.
Select your time perspective from the top right drop-down list and which markets and sectors to include. Following are three groups of filters: General criteria, Technical criteria and Financial criteria. Note that certain filters and criteria are only available for some markets.
Markets

Pick your markets from which to select stocks. For example Oslo, Stockholm and Copenhagen. The report will show stocks that fit your criteria from all three markets, and you may get even better stocks than if you select from one market only.
It can be difficult to find very good candidates in smaller markets when the Exchange is weak or has moved sideways for some time. Multiple markets increase the chance of finding good stocks.
Sectors

The report contains all kinds of companies, regardless of sector or industry. However, you can set sectors like Finance or Energy, or more detailed industries like Insurance or Oil drilling. The report will show only stocks within these sectors that also fit your other criteria.
Combining Markets and Sectors can for instance give ranked lists of the best bank stocks in the Nordic countries.
Filters
Click criteria on and off for each group. An active filter is highlighted in colour, while an inactive filter is neutral. Click and drag the slider to set values for each filter.

Active filter in the middle, inactive on the left and right.
General criteria
General criteria are used to set size, liquidity and volatility of the companies you are looking for. It is easier to trade bigger, more liquid companies, but the best opportunities are often found in smaller companies. Volatility is measured in percentage per month and indicates how much the price has fluctuated historically. Large fluctuations carry high risk, but also often significant upside potential.
Technical criteria

Technical criteria show investor behaviour and the development of optimism in the stocks, interpreted through the stocks' price charts. Technical score is a total assessment of the stock, calculated quantitatively by Investtech's computers. The algorithm assesses trend, support and resistance, volume development and buy signals from price patterns. Investtech's research shows that signals from trend, momentum and volume balance are statistically important, and you may choose to define your own criteria for all of these.
Technical criteria can be useful as a timing tool. According to technical analysis, optimism in stocks with these technical signals is increasing and the price will continue upwards in the next weeks and months.
Financial criteria

Financial criteria cover company valuation. These are criteria used in fundamental stock analysis.
Financial criteria can be useful in finding stocks that are cheap based on key ratios. Fundamental analysts expect many such stocks to rise in the long term. Note that financial key ratios can vary a great deal from sector to sector, and knowledge of the sector and the individual companies are often necessary for interpretation of key ratio figures.
Explanation of table

The table is automatically sorted by technical score. Click the column headings to sort by other values.
Technical score: Technical evaluation of the stock is done automatically by Investtechs computers. The evaluation scale is from -100 to +100, where scores below -50 are "negative candidates", between -50 and -25 are "weak negative", between -25 and +25 are "watch", between 25 and 50 are "weak positive" and over 50 are positive candidates.
CAP: Capitalised value is market value in billion, calculated as stock price multiplied by shares outstanding.
Liquidity: Average daily turnover in million in the past month.
Volatility: Average difference between the highest and lowest price per month, calculated for the past year. Volatility is a common measurement of risk.
Rsi21: 21 day Relative Strength Index. Used to measure the short term momentum of the stock.
Volbal: 22 day Volume Balance. Measures volume vs price movement.
Yield: Dividend yield is the company's share dividend in relation to the share price. It is a measure of return to shareholders. Dividend yield is calculated as Dividend per share/Share price.
P/E: P/E stands for Price/Earnings, that is, share price in relation to the earnings per share. The key figures are used when assessing a share price in relation to the company's profit.
P/S :P/S stands for Price/Sales, that is price relative to sales. The key figures are used when evaluating a share price in relation to the company's sales.
P/B: P/B stands for Price/BookValue, that is price relative to equity. The key figures are used when evaluating a share price in relation to book equity.
Overall: Shows the sum of market value and daily liquidity for all stocks. The values for columns Technical score, Volatility, RSI, VolBal and Yield are a weighted average, where the weight is capitalized value. The values for columns P/E, P/S and P/B are calculated as the sum of market value (P) divided by the sum of Earnings (E), Sales (S) and BookValue (B) respectively.
Mean: Average value for all stocks.
Median: Median value for all stocks.
Trading opportunities
Stock prices occasionally exhibit combinations of technical indicators that strongly predict large price movements. Such combinations rarely occur, but when they do, there are often opportunities for very profitable trades. We call this trading opportunities. Stocks with trading opportunities will often have a high upside while the downside is low.
Investtechs systems identify ten different kinds of trading opportunities. When you select Trad. opportunities from the left-hand menu, all the different kinds of trading opportunities are shown in the list. Select a particular kind from the table header. You can choose between short term, medium term and long term trading opportunities.

The following information is given for each stock in the list:
Score: Every trading opportunity is given a score between 0 and 100. This score is shown in both the tables and on the details pages. The higher the score, the better the stock satisfies the criteria that theoretically define the trading opportunity, and the better the possibility to make a profitable trade with the stock. Note that several of the technical indicators that we measure per stock are not included in the computation of score for trading opportunities. Some of these, such as support and resistance, trend direction and volume balance, can be very important for the technical outlook of a stock. The trading opportunities with the highest scores will therefore not automatically be the best trades. We therefore recommend that users look at the whole picture, short and long term, and for example also evaluate fundamental information before trading. Kindly note that risk is not included in the calculation of the score. Two stocks with the same score can have very different risks. Stocks with very low liquidity will be excluded from trading opportunities, but the liquidity requirements to be included in trading opportunities are relatively low. Only trading opportunities with a score of 70 or higher are listed. Institutional users can change this limit under "Profile".
Risk/reward ratio: The risk/reward ratio is calculated as the upside potential vs. the downside potential, i.e. the reward of a successful investment (selling at target price) compared to the result in case of a failed investment (selling at stop loss). The downside potential is always set to 1, so the higher the upside potential, the higher the return.
Potential: Upside, measured in percentage. Calculated as increase in percent from recommended buy price to target price. Note that stocks with a high upside also tend to be high risk.
Access a specific trading opportunity to see recommended buy price, target and stop loss. You get concrete suggestions for where to buy and sell the stock, and the opportunity to consider upside vs. downside. Also listed are a presumed time horizon for the investment and conditions that strengthen or weaken the stock.
Oversold RSI and price near support
An oversold stock has fallen significantly in a short time, and a reaction up is implied. Price near support says that the price will rise. At the same time, placing stop loss just below the support ensures a small downside.
Theory:
RSI stands for Relative Strength Index and is defined as 100 times the sum of the last N days rise, divided by (the sum of the last N days rise plus the sum of the last N days fall), where N is 14, 21 or 90 for the short, medium and long term chart, respectively.
Oversold RSI, meaning low RSI-values, means that lately the price has fallen a lot without many reactions up inbetween. There has been too much focus on negative aspects, and the stock has been dominated by sellers. This cannot last indefinitely, and the stock should see a reaction up soon.
The fact that the price is near the support, means that when the price was at this level previously, the price showed an upward reaction. Investors who did not profit from the last increase, will want to buy now, and those who did buy the last time, but sold again, will want to buy again.
When these criteria occur simultaneously, we get a strong signal that the price will rise. At the same time, we have the opportunity to invest with a low risk, by placing a stop loss just below the support.
Score:
The closer the price is to the support, and the stronger the support level is, the higher the score. RSI should in addition be low and the volume balance and the relationship between volume tops and price tops should be positive. Also, it is positive if a bottom is formed in the price or RSI chart.
Buying price:
Is set one "normal movement" above the support level. A "normal movement" is defined as the average price movement during a period equal to about one percent of the length of the chart.
Price target:
Is set to the estimated theoretic maximum price, given that the price develops as a slightly coloured random walk for 20% of the length of the chart. Normally, this will be 15-30 procent of the height of the chart.
Stop loss:
Is set to approximately one "normal movement" below the support level.
Time horizon:
Is set from 14 to 20% of the length of the chart.
Positive divergence between RSI and price, and price near support
Positive divergence between RSI and price implies that the price will rise. Price near support implies that the price will rise. At the same time, placing stop loss just below support ensures a small downside.
Theory:
RSI measures the degree to which buyers or sellers have been influencing the price lately. Low values mean that sellers have been most influential, while high values mean that buyers have been most influential.
When the RSI chart is increasing, this means that buy interest is increasing and that buyers get relatively more influence in determining the price. If this happens while the price is moving sideways, or downwards, this is seen as an early signal of a possible upward movement of the price.
The fact that the price is near the support means that when the price was at this level previously, the price showed an upward reaction. Investors who did not profit from the last increase, will want to buy now, and those who did buy the last time, but sold again, will want to buy again.
When these criteria occur simultaneously, we get a strong signal that the price will rise. At the same time, we have the opportunity to invest with low risk, by placing a stop loss just below the support.
Score:
The degree of divergence between RSI and price is important for the calculation of the score. In addition, the price should be near the support and the support should be strong. Volume balance and the relationship between volume tops and price tops is also considered. Trend and price patterns also are taken into account.
Buying price:
Is set one "normal movement" above the support level. A "normal movement" is defined as the average price movement during a period equal to about one per cent of the length of the chart.
Price target:
Is set to the estimated theoretical maximum price, given that the price develops as a slightly coloured random walk for 20 % of the length of the chart.
Normally, this will be 15-30 per cent of the height of the chart.
Stop loss:
Is set to approximately one "normal movement" below the support level.
Time horizon:
Is set from 14 to 20 % of the length of the chart.
Buy signal from rectangle formation in a rising trend
A rising trend indicates that investors are more positive and that the price will continue to rise within the trend channel. Additionally, a buy signal from a rectangle formation indicates short term rise as well.
Theory: As described under "Rising trend and price near support", a stock within a rising trend is expected to continue rising. When a rectangle formation develops, a resistance is formed with sellers near the ceiling of the rectangle. When the price rises through the resistance this means that these sellers have been exhausted. The buying side is still the same size, but there is now a lack of sellers such that the price is driven higher. If one acts quickly and buys near the support (the old resistance) of the rectangle, one gets a good buying price and can place a tight stop loss. If the price has risen substantially after the break of the rectangle, it may be better to await a reaction back before buying.
Score: The formation's and the trend's quality, i.e. the similarity to a theoretically perfect formation and trend, are important for computing the score. The size of the formation and how long ago it was broken are also important contributors to the score. A price near the support of the formation results in a higher score than a price near the price target of the formation. If the price has reacted back below the support line after the break, this is negative. It is also negative if other formations have been formed after the break.
Buying price: Is set to the support of the formation and a little up (about 20 % of the height of the formation).
Price target: Is set to 90-125 % of the price target from the formation break.
Stop loss: Is set to 20 % of the height of the formation below the signal level of the formation, i.e. about a fifth down in the formation. For more flexibility, a stop loss can be placed just below the middle of the formation.
Time horizon: From 40 % to 80 % of the formation's height.
Rectangle formation developing in a rising trend and price near rectangle support
A rectangle formation in a rising trend is formed when investors need a break from the rise. The upside is big, both short term and long, when buying near the floor of the rectangle.
Theory: As described under "Rising trend and price near support", a stock in a rising trend is expected to continue rising within the trend channel. When the stock develops a rectangle formation, this is seen as a consolidation or pause before the rise continues. This is true even if the trend is broken while the rectangle formation develops, although this will increase the risk of a downward break. Often the price rises quickly once a rectangle formation is broken. Therefore, one will get a much better buying price if one buys before the break. The best buying price is at the floor of the rectangle formation. A suitable stop loss can be set right below the floor, such that the downward potential is low and the risk/reward high. Careful investors can choose to get out of the stock at the ceiling of the rectangle formation, while those who want the highest possible return should wait until the price target is reached.
Score: The quality of the formation and the trend, meaning their similarity to a theoretically ideal formation and trend, is important for the calculation of the score. A price near the floor of the rectangle gives a higher score than a price near the ceiling. It is positive if the price is well positioned in relation to horizontal support and resistance levels, or if RSI is oversold. If the price has broken out of the rising trend channel, this is negative.
Buying price: Is set to the support of the formation and a little up (about 3 0% of the height of the formation).
Price target: The lower target is set to the ceiling of the rectangle formation and the upper target is set to the price target of the rectangle formation once broken up.
Stop loss: Is set to 20 % of the height of the rectangle below the floor in the rectangle.
Time horizon: From 40 % (lower price target) to 120 % (upper price target) of the formation's length.
Inverse head-and-shoulder formation under development and positive volume balance
Inverse head-and-shoulder formations signal a reversal from falling to rising trends. By buying early, before a proper signal is triggered, the upside is big. There will be uncertainty as to whether the signal is really triggered, but a positive volume balance often indicates that buyers are aggressive.
Theory: Inverse Head-and-Shoulders is a trend reversal formation and signals a reversal from a falling to a rising trend, or in other words, the start of a rising trend. The idea is that the stock has been negative for a long time and that the focus has been on negative news and weak prospects. This causes investors in the left shoulder as well as the head to press the price to bottoms lower than previous bottoms. With the rise in the head, the price reaches the level of the previous top. In a falling trend, following tops should be lower, so this is an early signal that the falling trend is ending. When we see that the price in the right shoulder forms a bottom that is higher than the bottom in the head, we have an indication that a rising trend is starting. The confirmation is when the price breaks up through the neckline. This means that the following top also will be higher than the previous top. It can often be profitable to buy while the inverse head-and-shoulder formation is developing, since the price often rises quickly once the neckline has been broken.
Positive volum balance is an isolated indication that the trend is rising, or that a falling trend is ending. Therefore the risk/reward ratio is seen as attractive when both these circumstances occur at the same time, i.e. when we have an inverse head-and-shoulder formation developing and volume balance is positive.
Score: The quality of the formation and trend, i.e. the similarity to a theoretically perfect formation and trend, is important for calculation of the score. A price close to the bottom in the right shoulder gives a higher score than a price near the neckline. Volume balance and correlation between price and volume development are important contributors to the total score. It is positive is the price is well positioned related to horizontal support and resistance level, but this is not weighted much. Also, a low RSI is positive. If the formation is formed near the maximum in the chart, this lowers the score, because the price cannot have fallen much before the development of the formation. It is also negative is the formation is very big compared to the trend.
Buying price: Is set from the support in the right shoulder to halfway to the neckline.
Price target: The lower price target is set to the neckline and the upper price target is sett to the price target from the inverse head-and-shoulder pattern.
Stop loss: If the "shoulder height" is defined as the height between the support in the shoulders and the neckline, the stopp loss is set to 20 % of the shoulder height below the support in the right shoulder.
Time horizon: From 40 % (lower price target) to 120 % (upper price target) of the formation's length.
Reaction back to support after buy signal from a formation
A buy signal from a price formation indicates increasing optimism and further rise for the stock. The price has now reacted back in the short term and there is an opportunity for a good entry price by buying just above the formation support.
Theory: When a price formation is broken, this often means the psychology of the market actors taken as a whole is in a special mode. This can for example be that many are sorry they did not buy earlier, or that many are sorry they sold too early. In general, we can say that when a resistance level is broken, all sellers who were on this level(perhaps due to fundamental reasons) are gone. So, the sell side is gone, while the buy side is still there. When a buy signal from a formation is given, this then often causes the price to rapidly rise further. It may then be difficult to buy at a good price. Sometimes, however, there is a reaction back after a formation break. This gives buyers a new chance to get in on the stock, and this time to a good price. It is also possible to invest with a low risk if one sets stop loss just below the support from the formation.
Score: With ideal trading opportunities like this, the price has almost, but not completely, reached the price target of the formation and has then reacted back to a level relatively close to the support from the formation. A lower score is given if the price already has reached the price target before it reacts back. A high quality of the formation, meaning that the formation is very similar to a theoretically perfect formation, results in a high score. The size and age of the formation, meaning how long ago it was broken, also contribute to the score. Volume balance and correlation between volume tops and price tops are also important for calculation of the score. If the price has been below the support line after the break, this is seen as negative. It is also negative if other formations have been formed after the break.
Buying price: Is set to the support of the formation and a little up (about 20 % of the height of the formation).
Price target: Is set to 90-125 % of the price target from the break of the formation.
Stop loss: Is set to 20 % of the height of the formation below the signal level of the formation, i.e. 20 % below the support of the formation.
Time horizon: From 30 % to 60 % of the formation's length. The same percentage is used for all types of formations, even though the signals from rectangles are reached quicker than signals from double-bottom formations and inverse head-and-shoulder formations.
Resistance broken and price near chart maximum
A break through resistance is a buy signal. When the price is near chart maximum, the investors have found reasons to buy the stock in spite of record levels. There is little or no resistance above todays level and further rise is indicated.
Theory: Earlier tops in the price are important for defining resistance levels. Many will think that since the price dropped at this level earlier, it might do this again. A high accumulated volume at a certain price level is also important for defining resistance. It is probable that many will want to sell again at this level - either to repeat a good sale from earlier, or to sell without a loss. At resistance levels, there will therefore be more sellers. When the price breaks up through the resistance, this means that sellers at this level have sold their stocks. There still is buy interest, and the price rises further since there now are too few sellers. If a resistance is broken near the top in a chart, this means there is very little resistance above the current price. Maybe it also means the price has reached an all-time high, and that there is no resistance at all. The price is therefor not hindered by sellers who want to get out without a loss, and the stock can quickly rise further.
Score: The most important factors in calculation of the score are the strength of the resistance that has been broken, the distance from the price down to this level, and the distance from the price up to the maximum price in the chart. In addition, trend, possible formations, and volume development are taken into account.
Buying price: Is set one "normal movement" above the support level. A "normal movement" is defined as the average price movement during a period equal to about one percent of the length of the chart.
Price target: Is set to the estimated theoretical maximum price, given that the price develops as a slightly coloured random walk for 20 % of the length of the chart.
Normally, this will be 15-30 procent of the height of the chart.
Stop loss: Is set to approximately one "normal movement" below the support level.
Time horizon: Is set from 14 to 20 % of the length of the chart.
Buy signal after false sell signal
A buy signal following a false sell signal is often a very strong signal. It indicates that investors are becoming positive. A further rise is indicated, while its a short drop down to resistance level.
Theory: A sell signal from a price formation is triggered when an important support level is broken. The psychology of the market players and the company's position in its business cycle then predict that the price will drop further. Many investors will sell. If the price does not fall down to the price target of the formation, but instead rises, this often indicates that new and positive information has become available, and that new investors are buying. The sell signal was false. There are few things as irritating as a stock one just has sold rising strongly. But the stock is now more expensive than when one sold, so most of those who sold on the break down, will not do anything now. The stock continues to rise and breaks up on the opposite side of the formation. Sellers at the resistance level of the formation are gone now, there is a lack of sellers and a buy signal has been triggered. What is special about this situation is that the sellers below the floor of the formation are gone too, so that there will be an even greater imbalance between buyers and sellers than with a normal buy signal. A further rise is indicated, and one has the possibility to set a tight stop loss right below the ceiling of the formation.
Another way this can be explained is that the news surrounding the company became negative, or less positive than earlier, at the break down through the formation. Many sell based on this fundamental information. However, this turned out to be wrong, because the news turn positive again and the price rises. What seemed so negative was not so negative after all, and new positive impulses have come. The price breaks upward through the formation resistance, and sellers below the floor of the formation and sellers at the resistance are both gone. A powerful buy signal has been triggered, and a further rise is indicated.
Score: The most important criteria for calculating score for this type of trading opportunity are whether the break up happens relatively quickly after the break down, whether the volume development is positive and whether the price is near the support in the ceiling of the formation. In addition, the quality of the formation and the direction of the trend are taken into account.
Buying price: The ceiling of the formation is calculated as the line between the tops in the two shoulders in a head-and-shoulder formation, as the line between the two tops in a double-top formation and as the resistance line in a rectangle formation. A buy signal is given when this ceiling is broken, and the buying price is set from the ceiling and a little up (about 20 % of the height of the formation).
Price target: Is set to 90-125 % of the price target from the formation break.
Stop loss: Is set to 20 % of the formation's heigth under the ceiling of the formation.
Time horizon: From 40 % to 80 % of the formation's length.
Positive on Insider Trading and near support level
Positive insiders indicate that the stock is fundamentally cheap. At the same time, the stock is near support, where many investors and traders feel the stock is cheap.
Theory: The Insiders in a company know a lot about the company, the market the company operates in and the future outlook. Maybe they even have better knowledge than analysts and investors that track the stock. When Insiders bet their own savings that the price will rise, and buy stocks in the company, this means they believe the stock to be fundamentally cheap. When the stock price is near a support level, this either means it has fallen back to a support level, or that it has broken up through a resistance level and given a buy signal. In both cases, the psychology of the market indicates that the price should rise further. When the stock is both fundamentally cheap (postive on Insider Trading) and technically positive, one has good chances of making a good investment.
Insider Trading score is only calculated for the medium long term, and only for the Norwegian and Swedish markets, so this trading opportunity only exists for the medium long term for Norway and Sweden.
Score: The most important elements in calculating the score for this trading opportunity are Insider Trading score, the strength of the support level and the distance to the support level. In addition, the change in Insider Trading score for the last week, trend, formation and volume development are taken into account.
Buying price: Is set one "normal movement" above the support level. A "normal movement" is defined as the average price movement during a period equal to about one percent of the length of the chart.
Price target: Is set to the estimated theoretical maximum price, given that the price develops as a slightly coloured random walk for 20 % of the length of the chart. Normally, this will be 15-30 percent of the height of the chart.
Stop loss: Is set to approximately one "normal movement" below the support level.
Time horizon: Is set from 14 to 20 % of the length of the chart.
Signals
The tool Signals provides an overview of the latest positive and negative signals identified by Investtechs systems. Signals from price formations are assumed to indicate in which direction the majority of investors are moving.
The tool is especially useful for investors whose strategy includes investing when certain signals are triggered. For example, investments based on rectangle formations have given good results.
The tool can be used as a stock picking tool when looking for new stocks to invest in.

Options (selected from table header):
- Positive, negative and neutral signals.
- All indicators or one in particular.
- Time horizon: short, medium or long term.
Contents of table
Date: Price date when the signal was identified.
Indicator: Name of indicator.
Quality: For price formations, a quality between 0 and 100 points is given depending on how similar the formation is to a theoretically ideal formation according to technical analysis theory. Some deviation is accepted, but if the quality is below 40 points, the formation will not be drawn in the charts.
Objective: Target price. The signal from the pattern says that the stock will rise to this target or higher in a period of time which is as long as the pattern. In the case of negative signals, the objective says how far the stock will fall.
Pivot points
Pivot points are tops and bottoms in the chart. Investtech has a unique system for identifying such points. By looking at charts where new bottoms have been identified, stocks that are going to rise can be identified very early.
It is a sign of increasing investor optimism when a stock reverses after falling for a long time. There will always be a delay in the market due to the fact that information is scattered and processed at different times. When someone has seen the opportunities and become positive, others will follow. The idea of the Pivot points tool is to identify such situations as early as possible, which will enable you to be among the first to trade when the investors mood changes.
Investtech has developed computer systems which identify such turning points in stocks. In order for a bottom point to be drawn in the chart and appear in the lists, the price must have moved significantly from the bottom. Two factors determine whether movement is considered significant; a) the change in percentage and b) the number of days in which this happened. If we see a major price change, it is enough if the movement lasted for a few days. If the price change is small, it must last for several days.
The Pivot points list is a stock picking tool. The most common usage is looking at stocks with new price chart bottoms in ones investment time frame. Candidates identified in this way should then be put through the usual chart analysis. It is especially important to study volume. A price movement on increasing volume is considered much more reliable than one on low or unchanged volume. A price movement in the same direction as the trend will be considered more reliable than one moving in the opposite direction.

Days since identification: Number of stock exchange days since Investtechs systems identified the pivot point.
Days since: Number of days since the pivot point.
Pivot point: The price at the pivot point.
Trend signals
Rising trends indicate that the company experiences positive development and increasing buy interest among investors.
The tool Trend signals shows stocks that have recently entered a rising or falling trend. The list can be used to identify buy candidates. A very simple strategy is buying stocks that recently triggered a trend signal and keeping them until they exit the rising trend.
Investtech has conducted reasearch on price development following trend signals. We have developed statistics for the Norwegian and Swedish stock exchanges and assume that the results will hold true for other exchanges as well. The statistics show that stocks in rising trends do better than the exchange average both short and long term, whereas stocks in falling trends do worse.
Thus analysis of trends and trading based on trend signals are important parts of technical analysis.
Table explanation

Days in trend: Number of days the stock has been in the trend drawn in the chart.
Rising rate (degrees): Visual rising rate of the trend channel in the chart. From 0 (horizontal) to 90 degrees (vertical).
Rising rate (pct.): Rising rate in percentage if the stock continues in the trend channel for one year.
Note that a stock can enter a rising trend in two ways: 1) The trend in the chart changes, for example from an (old) falling trend to a (new) rising trend. 2) The price was above the trend ceiling or below the trend floor and entered the trend.
Good statistical basis
 A research report from Investtech dated May 2016 shows that a stock tends to follow the trend it is in. Thus if the stock is in a rising trend, it will continue to rise. If it is in a falling trend, it will continue to fall. This can be partly explained by the fact that news tend to come in series. A positive piece of news is usually followed by more positive news. The market grasps the first positive news, but not the probability of more positive news to follow. Consequently it can pay off to buy stocks that show positive development, anticipating that the trend will continue.
Investtech has developed computer systems that automatically identify rising and falling trends. In the period 1996 to 2015, 28,580 buy signals from stocks entering rising trends were identified, along with 16,348 sell signals from stocks entering falling trends. Investtechs research report shows that the stocks in rising trends on average went up 5.5 per cent the following months, while stocks in falling trends on average rose by 0.9 per cent. In comparison the benchmark indices on average rose by 3.6 per cent in 3 months.
Seasonal variations
Analysis of seasonal variations shows how a stock statistically has varied throughout the year. Some stocks appear to have particularly positive or negative price development in for example spring or autumn, or in certain months. These analyses show the stocks expected development, if it develops as it has in the past few years.
Seasonal prediction

The chart shows average price development and standard deviation for the stock price. The blue line shows the average. The dark shaded area is one standard deviation and the light shaded area is two standard deviations. The length of time the statistic is based on, is shown below the chart.
Assuming the stock has the same development each year, with annual statistical deviations, the chart shows how price development has been for the past three months and how it will be in the next six months.
The black line is actual price development the past three months, and the black dot is last closing price.
Average per calendar day is calculated by geometric mean, so that the mean value of for example +10 % and -9 % is 0 %. Estimator variance is calculated as the cumulative sum of variance per date, and the standard deviation is the square root thereof.
Note that the chart shows the estimated mean value of the seasonally adjusted stock and should not be used as a direct estimate of future price development. There are great fluctuations from year to year, both up and down compared to the average.
Monthly statistics

The chart shows average price changes for each month of the year.
Seasonal statistics

The chart shows the stocks price development in an average year, from January 1st to December 31st.
Annual price changes
The charts show price development for each of the past five years. Note that there is great variation from year to year. A year of particularly positive or negative development will significantly influence the average. Use seasonal prediction with care.
Overall Analysis
Overall Analysis gives a quick overview of a stock's technical and quantitative characteristics.
The technical score for Overall Analysis is calculated as a normalised sum of the technical score for short, medium and long term analyses. The score from Insider Trading analysis is also used where available.
Note that the technical score for Overall Analysis may be higher than the average of the short, medium and long term analyses. This is due to normalisation adjustments, which means a stock that is a weak positive on many criteria can become more positive overall.
Trading Limits
Trading Limits shows the stocks historical development throughout the trading day and its statistical price fluctuation. This can help you place good limit orders, facilitating execution at good prices.
Intraday fluctuations

The chart shows the stocks average development throughout the day quarter by quarter. Each body represents 15 minutes. The body is white when the price rises and black when the price falls. The shadows indicate highest and lowest price. Green and red volume columns signify rising and falling prices respectively. The column to the far right includes the Closing Auction and is often significantly taller than the others.
Some stocks tend to move with certain patterns throughout the day, which these charts may show. The statistics cover four time horizons: 5, 22, 66 and 250 days, which correspond to the past week, month, quarter and year, respectively.
Estimated prices
The table shows, calculated from yesterdays closing price, which prices the stock is expected to fluctuate between today. The estimate presumes no significant news being published between yesterdays close and the Exchange opening.
Note that news related to the company may cause great fluctuations on the day of publication. This can influence historical average figures to a great extent, resulting in charts and statistics giving a misleading indication of expected statistical fluctuation.
Factor diagram
Investtechs Factor diagram visualises the stocks most important qualities. The more green, the more positive the stock is considered to be. If the stock is weak or quite weak, the diagram is red.

Each factor is given a score on a scale from -100 to +100. A score above +50 is considered strong for this factor. Scores between 25 and 50 indicate quite strong, -25 to +25 neutral, between -25 and -50 quite weak and below -50 weak.
The stock shown in the diagram here is strong for factors Quantitative, Technical and Stability, quite weak for Insider and weak for factor Fundamental. The middle circle in the diagram represents neutral score and the outer circle maximally positive score.
One single element provides the total factor score for certain factors, while other factors are calculated from several element values. Access to information about each contributing element and the exact numerical score of each factor is available on subscription level Trader and above.
Mouseover is available on the chart pages, where moving your pointer across each factor brings up information about factor score and the underlying value calculations.
Technical
Technical shows the stocks strength based on short, medium and long term technical analysis. The stronger the stock, the higher investor optimism is considered to be. According to Investtechs research, technically positive stocks have developed well and outperformed other stocks.
The factor is calculated from Investtechs automatic technical analysis in the short, medium and long term. RSI momentum is also used, where values above 70 are strongly positive, below 30 strongly negative and between 40 and 60 quite neutral.
Technical analyses are the absolute most important analyses on Investtechs website. Read more about these analyses on our Help pages. You are also welcome to peruse research and statistics where we have studied how well the different technical signals performed in the past.
Quantitative
Quantitative measures the stocks estimated future return compared to the other stocks in the market. The factor is calculated from the statistical return of stocks with similar quantitative characteristics. The stocks trend status, support and resistance levels, price patterns, momentum and insider trades are used, and the score is adjusted for high or low volatility and liquidity.
The factor is calculated from signal statistics for Nordic stocks, presented in Investtechs research reports on trends, support and resistance and insider trades. The same elements as shown in the Investtech research box on the chart page are included, but are often adjusted in accordance with the stocks volatility and liquidity. In particular, stocks with extremely high or increasing volatility may have their score reduced due to the historically negative statistical development of such stocks.
Only stocks with an average daily turnover of at least 50.000 EUR are given a score. Lower turnover makes the factor uncertain and its then set to neutral score.
The factor is based on a ranking of stocks, such that the 10 per cent strongest stocks have a score above 80. The 25 per cent strongest stocks have a score above 50 and are classified as strong. Regardless of how negative or positive the stock market is, 25 per cent of stocks will always be quantitatively strong and 25 per cent quantitatively weak.
Insider
Insider is the stocks assessment based on reported insider trades. When directors of the board, executives and other insiders who are required to report trades purchase stocks in their respective companies, it indicates that they believe in rising prices and that no immediate negative surprises are forthcoming. Insider analysis can be considered a simplified fundamental analysis.
The factor score is the same as the stocks insider score, available for Norwegian, Swedish and Danish stocks. Read more about insider analysis here.
Stability
Stability is an assessment of the likely stability of the stock price. Stocks with high stability have historically had low price fluctuations, strong liquidity and been listed on the stock exchange for a long time. The risk of falling prices is low in such stocks, but the upside can be low as well. In other words, expect stable price development with only small changes. Stocks with low stability have high risk. It is risky to own and trade them, and they can both fall and rise a lot in a short period of time.
Three elements make up the calculation of stability: the stocks volatility, measured by historical monthly price fluctuations, the stocks liquidity, measured by historical daily turnover in local currency, and the stocks duration as listed on the stock exchange.
Volatility is considered the most important factor and counts double towards the final score. Stocks with less than 10 per cent volatility get the highest stability value, while volatility above 40 per cent gives the lowest value. Volatility between approximately 17 and 25 per cent on a monthly basis gives a fairly neutral value.
Liquidity often correlates with the size of the company. Large companies tend to be more stable over time and easier to trade than smaller companies. High liquidity stocks, with liquidity above 10 million EUR, get the highest stability value, while those with liquidity below 100,000 EUR get the lowest value. Liquidity between approximately 100,000 and 1 million EUR get a quite neutral value.
Recently listed stocks are considered high risk, as they are often quite recently established companies in an early phase of development, which involves high uncertainty. Lowest value is assigned stocks with less than 1 years history on the stock exchange. Old companies that have been listed for 25 years or more, get the highest value. Neutral value is assigned companies that have been listed between approximately 6 and 12 years.
Fundamental
Fundamental describes the stocks value based on accounting value and financial quality. The factor is calculated from stock price vs the companys earnings, i.e. its P/E (price-to-earnings ratio) and its book value, i.e. P/B (price-to-book value ratio). High fundamental value often means low downside risk, while low fundamental value often indicates good growth opportunities and a large upside.
P/E below 10 gives maximally negative element value, while negative P/E or P/E above 200 give minimal value. P/E scores between 20 and 30 give quite neutral values. P/B below 1 gives max element value, while P/B above 20 gives minimal value. P/B values between 2.5 and 4.0 give quite neutral values.
The P/E and P/B elements are equally weighted in the total score of this factor.
Note that this factor measures the fundamental value of the stock, i.e. the equity of each stock and its earnings. The factor does not speak to growth qualities. Investors will often highly value growth and growth potential and thus pay more for such stocks compared to the companies current equity and profit. Thus, a stocks growth quality will often be the opposite of its value quality.
Stocks with high growth potential will usually be found among the stocks with low fundamental score.
Stocks with a high Investtech Fundamental score have high fundamental value and are considered safer, more robust and better equipped to tolerate stock market unrest.
Four or five Factors
Factor diagrams are available for all Nordic stocks. Norwegian, Swedish and Danish stocks have factor diagrams with the five factors described above.

Investtech does not have insider trade data for the Finnish market. The factor diagram for Finnish stocks, and for Investor subscribers, consists of the other four factors, less Insider score.
The stock shown in this diagram is strong on Technical and Stability, neutral on Quantitative and quite negative on Fundamental.
Investor subscribers have access to factor diagrams with these four factors. The Insider factor is not included. Note that fundamental key ratios are included in the factor diagram even for Investor subscribers, while a Trader subscription or higher is required for access to Fundamental details.
Trader subscribers have access to factor diagrams with all factors, including Insider for applicable markets. Professional subscriptions or higher are required for details and selection opportunites for insider trades.
Investtech Indices
Is it true that smaller companies over time outperform the big ones? How dangerous are the so-called lottery stocks? Which do better - stocks that have fallen and therefore look cheap, or stocks that have risen and are in rising trends?
These are questions we attempt to answer with Investtech's new tool: Investtech Indices
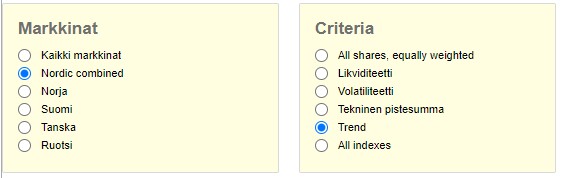
Investtech Indices are a collection of indices showing important drivers in the stock market. They show how stocks with different levels of liquidity, volatility and technical score have developed over time.
For instance, Investtech Indices show how stocks with buy and sell signals from trends have developed over time. A direct observation is that buying a portfolio of all stocks in rising trends, with stocks replaced monthly, have clearly overperformed vs an equivalent portfolio of stocks in falling trends.
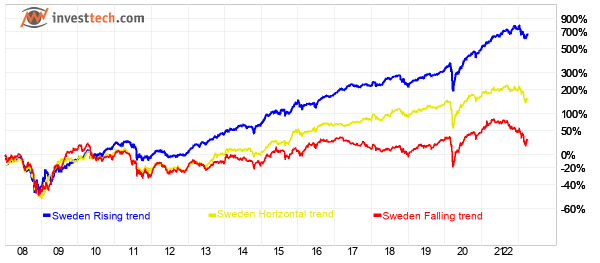
Figure: Development for Swedish stocks in falling, horizontal and rising trend channels in the period 2020 to 2022. It clearly shows that the group of stocks in falling trends have significantly underperformed compared to the others.
Stock market preferences change over time. Sometimes investors seek high return, something they look for low downside. Sometimes reversal candidates rise the most, and other times these same stocks fall the most. By looking at correlations between stock characteristics and pay off, daily, weekly or monthly, Investtech Indices can indicate which characteristics give the best return right now, and how stocks with different characteristcs have performed relative to each other.
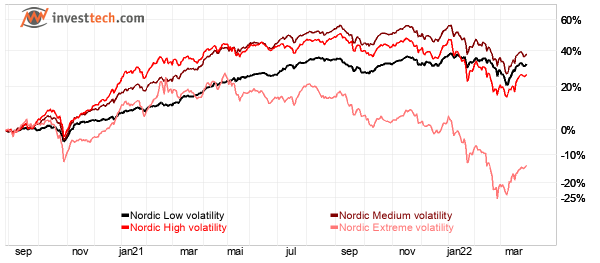
Figure: Development of Nordic stocks with different volatility in the period September 2020 to March 2022. It is clear that the group of extremely volatile stocks have significantly undeperformed compared to the others.
Long and short term price development is shown, along with historical return figures, and indices can be compared to each other. The tool is available to all subscribers on the Nordic markets. Trader level subscriptions and higher also give an overview of the which stocks are currently included in each index.
The indices cover Norway, Sweden, Denmark and Finland, and the Nordic markets combined. The calculation is balanced so that each stock in an index has the same weight, regardless of the size of the company.
In addition to factor indices, there are overreaching country indices, containing all stocks of sufficient liquidity. These will be a more fair basis of comparison for a portfolios return than stock market benchmark for small investors who invest about the same amount in each stock they own.
Technical conditions
- Updated daily, in the early morning, after all Nordic markets are updated.
- Minimum liquidity requirement for included stocks is 0.5 million NOK and 0.05 million EUR on average per day.
- Balanced calculation, so that for instance Ericsson, Novo Nordisk, Equinor, Kitron, Per Arsleff, Poolia and Kojamo all count the same in the total Nordic index, even though e.g. Novo Nordisk has a market value a thousand times that of Poolia.
- Re-weighting is done quartery, monthly or weekly. Stocks no longer meeting the index critetria are removed and new stocks may be included. Re-weighting is done again, so that a stock that for instance doubled last period and thus weighed double, is set to the same weight as all the others.
- Re-weighting intervals:
- Overall market indices: Quarterly
- Liquidity and volatility indices: Quarterly
- Technical score indices: Weekly
- Trend indices: Monthly
- Calculation parameters for the criteria:
- Liquidity: 22 day average.
- Volatility: annualised based on standard deviation last 66 days, normalised for categorization low, medium, high, extreme.
- Technical score: Medium term, set when re-weighting.
- Trend: Medium term, set when re-weighting.
- Volume shown below the charts and daily, weekly, monthly and quarterly liquidity shown on the chart page are the number of stocks that make up the index. This will be quite stable over time for market indices and the liqudity and volume based indices, while it will vary more for indices based on technical conditions.
Robustness calculation
Which stocks make up the various indices are determined at regular time intervals. The number of stocks in the different indices can therefore vary over time. If there are few stocks in an index, company specific events in the underlying stocks will influence index development to a larger extent than if there are many stocks in the index. Thus indices with many elements will be considered more reliable than indices with few elements.
We have developed a quality measurement for index robustness over time. Indices with many elements score higher and indices with fewer elements score lower. The longer the time periode with few elements, the lower the score.
Indices that continuously have more than 20 elements, get the max score. If number of elements is fewer than 20, the score will be lower the fewer elements are included and the longer the period of few elements is.
Availability
Investtech Indices are available for all subscribers on the Nordic markets. Trader level or higher subscriptions also give access to an overview of which stocks make up the indices at any time.
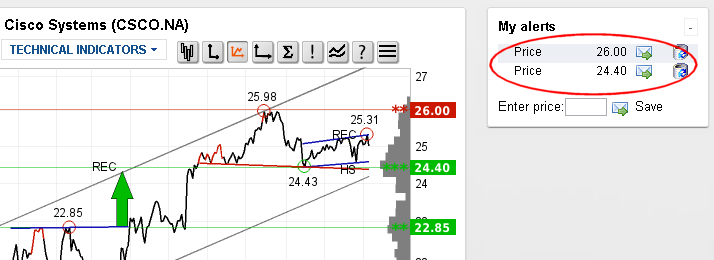
Price alerts: Be notified when the stock price reaches your specified level!
You may now enter a price alert for a stock and be notified when the price reaches this level.
Alerts entered are shown in My alerts in the menu. When a stock reaches or breaks a specified level, the row is checked and the date the alert was triggered is added. You will also be notified by e-mail after the exchanges closing. E-mail notifications can be switched off by clicking the e-mail symbol next to the specified alert price.
If several alerts are triggered on the same day, they will be collected in one e-mail. You will never receive more than one notification e-mail per market.
Any price alerts entered for stocks in My Portfolios will be indicated with coloured check marks on the My Portfolios page. These also show whether the specified price level is reached. Price alerts used in combination with the stocks in My Portfolios is a useful money management tool for controlling for instance breaks through stop loss and reached price targets.
Alert levels will not be automatically adjusted when charts are adjusted for splits, reverse splits or dividend payments.
Keywords: Help,kursvarsling,myAlerts.
My Portfolios User guide
My portfolios is a tool to help keep track of your stock investments. Start by clicking "New portfolio" to create a portfolio. Enter a name for your portfolio and select your portfolio's benchmark index. The chosen benchmark index determines the portfolio's currency and is used in the Health check. Then add transactions. Add transactions both when you buy and sell stocks.
Add transactions
Click «Add transaction» in order to add a transaction to the portfolio. A new window opens. Enter the stock's name or symbol and select the correct stock from the drop-down-list that appears. Choose whether to register a purchase or a sale. Enter number of stocks and select transaction date. Click "Save" to confirm.
Portfolio menu
In the Portfolio menu you can select a portfolio, delete portfolios and create new portfolios.
Portfolio settings
Use the Portfolio settings menu to change the name of your portfolio and delete a portfolio.
View
There are five different ways to view the stocks in the portfolio: Basic, Advanced, Indicators, Financial data and Transactions. You can choose between these to see different presentations of the portfolio.
Hausse index
The Hausse indices are indicators of optimism. They show the ratio of investors who are positive in the market.
An analysis of hausse indices is an important part of an overall market analysis. Hausse analysis can show the level of optimism among short term and long term investors, and whether the optimism is rising or falling. In special situations, following long rises or falls, hausse analysis can identify the turning points in the market.


Investtechs short term hausse index (hausse1) measures optimism among short term investors. The index is a good gauge for the level of activity in the market among investors who tend to keep a stock for one to six weeks. Investtechs long term hausse index (hausse2) measures optimism among long term investors. It shows mood swings in the market among long term investors who tend to keep the same stock for several months or years.
When a long term reversal in the market is coming, it can often be detected early by watching the actions of short term investors. Therefore an analysis of the short term hausse index is important, not only for short term fluctuations, but also for long term trends and reversals.
The two Trading Range strategies give a buy signal when the price of a stock moves above a previous top and a sell signal when the price moves below a previous bottom, in the short/medium term. Signals from price patterns and trends are considered to be significantly stronger than Trading Range signals, but Trading Range signals can in some cases be triggered sooner.
The Hausse index shows ratio of companies that have triggered buy signals
 We can measure optimism in a stock by seeing if investors are still willing to pay more than before for the stock. If this is the case, i.e. that the stock has risen above the previous top, the stock is given a buy signal in the hausse estimate.
 If the opposite is true, i.e. investors are willing to sell at lower prices, lower than previous bottoms, the stock is given a sell signal in the hausse estimate.
The Hausse index shows the ratio between number of companies that have triggered buy signals and total number of companies. The index has a value between 0 and 100, where 0 means that every companys last signal was a sell signal, and 100 means that every companys last signal was a buy signal. Values above 50 indicate that a majority of investors are positive.
Normal situation
Positive Hausse index:
- Rising Hausse values, after a notable bottom (increasing optimism)
- Value above 50 (high optimism)
- Rising tops and bottoms (long term improvement of optimism, but short term uncertainty)
- Strengthens or confirms a positive analysis of the market index
Negative Hausse index:
- Falling Hausse values, after a notable top (decreasing optimism)
- Values under 50 (low optimism)
- Falling tops and bottoms (long term reduction of optimism, but short term uncertainty)
- Strengthens or confirms a negative analyis of the market index
Important special situations
Elation:
- Very high Hausse value, 90 or above
- Almost everyone is positive, and consequently almost everything is positively priced in the stock market
- Almost any change will be negative
- Signals overheating of the market and that a major reaction/reversal is due soon
- Consider selling when the Hausse value drops below 90 again (falling optimism, emerging pessimism)
Dejection:
- Very low Hausse value, 10 or less
- Almost everyone is negative, and consequently almost everything is negatively priced in the stock market
- Almost any change will be positive
- Signals that a wide sales pressure will soon be over and that prices will start rising again
- Consider buying when the Hausse value climbs above 10 again (emerging optimism)
Investtechs Competence Program
The Competence Program teaches you Investtechs systems and what has historically given good results in the stock market. It is a good way to get started using Investtech's analyses, but also a way for experienced users to increase their confidence and get more out of the system.
Stock market success over time requires good analyses and correct timing. An Investtech subscription gives you analyses of individual stocks, well organised stock picking systems and concrete trading suggestions every day. The more experience and knowledge you have on investor psychology and how the market works, the better your chances of success on the stock market. The Competence Program was developed to help customers achieve the best possible use of Investtechs systems. We hope you will be satisfied with the program and that it will help you get good results in the stock market.
You will get various challenges and will notice that your competence level increases as you reach each target. The Program does not require any special use of Investtechs systems. You can use the analyses like you normally do. However, the Competence Program will provide encouragement and allow you to see your progress in various areas. You can stop or take a break from the Competence Program at any time.
Please click the links on the right hand side in order to read more about Points, Levels and Challenges in the Competence Program.
Investtechs Competence Program - Points
You earn Competence Points every time you use Investtechs stock picking tools or read a stock analysis, a help page or a research report. The Points describe the increased knowledge and experience you gain from using our site.
You must spend a certain amount of time on each page in order to be credited with the relevant Points. This information is shown in the Competence Program box on the right hand side of relevant page. Your total Points are shown on the top of any page.
When you have earned enough Competence Points, you reach the next level on the Competence Scale.
The following applies:
| Points | Page |
| 1 | Stock analysis |
| 10 | Daily Case, Market Commentary and Morning Report |
| 10 | Top50, Stock Selection, and other Stock Picking Products |
| 20 | My Portfolios and My Stocks |
| 10 | My notes |
| 20 (5) | Insight & Skills pages, including Indicator Help, Product Help and the Quick Start Guide |
| 100 (10) | Articles on research results and/or trading strategies |
| 200 (20) | Research Reports |
| 50 | Log in, per day |
| 0 | Uncategorized pages and articles |
You earn points for every stock analysis you access. For instance, both medium and short term analysis give points, but only once a day. All analysis and stock picking products from the left hand menu give points. When the analyses are updated, i.e. when new closing prices are available, you earn new points when accessing the analyses again.
Help pages and research articles give points the first time they are read. Some of this information can require some processing however, and therefore these pages give some additional points the next time you read them.
Investtech's Competence Program - Levels
When you join the Competence Program, you will acquire new knowledge and experience quickly. Your Competence Level will rapidly increase. Early on it will be very helpful to read the Insight & Skills pages. They teach you how Investtechs systems work, and how technical analysis should be understood and used. You will also learn much from reading our research reports. They outline how well various analyses actually work in the market, and which elements should be emphasized when stock trading. The research reports can be valuable when developing your own strategy on the stock market.
Once you have acquired knowledge about the analyses and systems, increased competence will come from using the system over time. It is important to log in regularly, check your stocks and check for signals in the market. It can also be a good idea to refresh your knowledge by re-reading research reports and consulting help pages.
The following applies:
| Level | Points required |
| 1 | 0 |
| 2 | 200 |
| 3 | 500 |
| 4 | 1000 |
| 5 | 1600 |
| 6 | 2500 |
| 7 | 4000 |
| 8 | 7000 |
| 9 | 10000 |
| 10 | 15000 |
The Level limits may change and the table be expanded if and when new elements are added to the Competence Program.
Investtechs Competence Program Challenges and Achievements
When you start the Competence Program, you are given some Challenges. These Challenges are designed to help you understand Investtechs systems and technical analyses as quickly as possible, as well as how these can help you become a better investor.
The Challenges can be logging in, reading various help pages and reading stock analyses. When you have completed the Challenges, you are awarded Stars. In time you will be able to unlock further Challenges. Click More information for information about why this Challenge matters and Link in order to go directly to the relevant page.

Please note that if a page has been registered and you have earned Competence Points for it, you have to wait for the next update before you can use this same page again for more Challenges.
Investtech guarantees neither the entirety nor accuracy of the analyses. Any consequent exposure related to the advice / signals which emerge in the analyses is completely and entirely at the investors own expense and risk. Investtech is not responsible for any loss, either directly or indirectly, which arises as a result of the use of Investtechs analyses. Details of any arising conflicts of interest will always appear in the investment recommendations. Further information about Investtechs analyses can be found here disclaimer.
The content provided by Investtech.com is NOT SEC or FSA regulated and is therefore not intended for US or UK consumers.
Head office
Strandveien 171366 Lysaker, Norway
Research department
Instituttveien 102007 Kjeller, Norway