Seasonal variations
Analysis of seasonal variations shows how a stock statistically has varied throughout the year. Some stocks appear to have particularly positive or negative price development in for example spring or autumn, or in certain months. These analyses show the stock’s expected development, if it develops as it has in the past few years.
Seasonal prediction

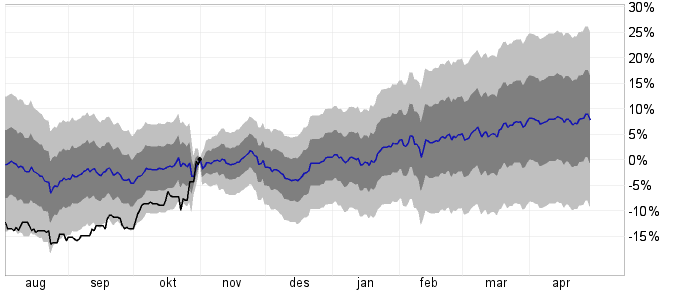
The chart shows average price development and standard deviation for the stock price. The blue line shows the average. The dark shaded area is one standard deviation and the light shaded area is two standard deviations. The length of time the statistic is based on, is shown below the chart.
Assuming the stock has the same development each year, with annual statistical deviations, the chart shows how price development has been for the past three months and how it will be in the next six months.
The black line is actual price development the past three months, and the black dot is last closing price.
Average per calendar day is calculated by geometric mean, so that the mean value of for example +10 % and -9 % is 0 %. Estimator variance is calculated as the cumulative sum of variance per date, and the standard deviation is the square root thereof.
Note that the chart shows the estimated mean value of the seasonally adjusted stock and should not be used as a direct estimate of future price development. There are great fluctuations from year to year, both up and down compared to the average.
Monthly statistics

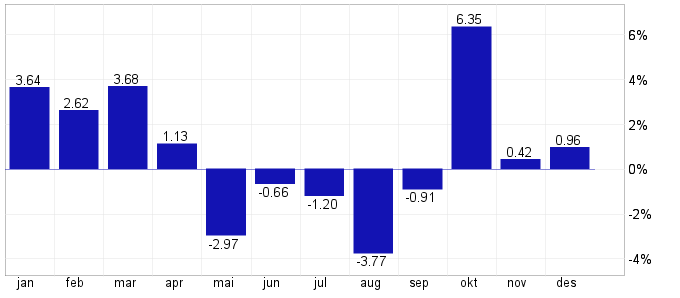
The chart shows average price changes for each month of the year.
Seasonal statistics

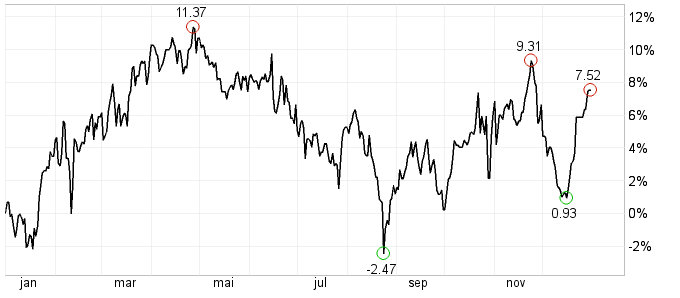
The chart shows the stock’s price development in an average year, from January 1st to December 31st.
Annual price changes
The charts show price development for each of the past five years. Note that there is great variation from year to year. A year of particularly positive or negative development will significantly influence the average. Use seasonal prediction with care.
Investtech guarantees neither the entirety nor accuracy of the analyses. Any consequent exposure related to the advice / signals which emerge in the analyses is completely and entirely at the investors own expense and risk. Investtech is not responsible for any loss, either directly or indirectly, which arises as a result of the use of Investtechs analyses. Details of any arising conflicts of interest will always appear in the investment recommendations. Further information about Investtechs analyses can be found here disclaimer.
The content provided by Investtech.com is NOT SEC or FSA regulated and is therefore not intended for US or UK consumers.


 Oslo Børs
 Stockholmsbörsen
 Københavns Fondsbørs
 Helsingin pörssi
 World Indices
 US Stocks
 Toronto Stock Exchange
 London Stock Exchange
 Euronext Amsterdam
 Euronext Brussel
 DAX
DAX CAC 40
 Mumbai S.E.
 Commodities
 Currency
 Cryptocurrency
 Exchange Traded Funds
 Investtech Indices
