
 Oslo Børs
 Stockholmsbörsen
 Københavns Fondsbørs
Investeringsforeninger
Københavns Fondsbørs
Investeringsforeninger
 Helsingin pörssi
 World Indices
 US Stocks
US 30
Nasdaq 100
US 500
US Stocks
US 30
Nasdaq 100
US 500
 Toronto Stock Exchange
 London Stock Exchange
 Euronext Amsterdam
 Euronext Brussel
 DAX
SDAX
TECDAX
Frankfurt
CDAX
MDAX
Prime Standard
DAX
SDAX
TECDAX
Frankfurt
CDAX
MDAX
Prime Standard
 CAC 40
 Mumbai S.E.
National S.E.
Mumbai S.E.
National S.E.
 Commodities
 Currency
 Cryptocurrency
 Exchange Traded Funds
 Investtech Indices
Find buy and sell opportunities by Candlesticks
Traditionally, candlestick analysis is used to identify short-term purchase and sale signals. By identifying candle patterns, one can understand something about the change in optimism or pessimism among investors. Thus, one can also predict whether stock prices are going to go up or down for the next few days. Such signals provide good opportunities to enter in or get out of the market at favourable times. At the same time, the patterns are short-term and exposed to noise, and many false signals occur. We recommend that candlestick analysis be combined with more long-term analysis on trends and volume development.
Hammer
Hammer is a one candle pattern which has a small real body (black or white) at the top of the trading range, a very long lower shadow and little or no upper shadow. The lower shadow should be at least twice the height of the real body. It must come after a decline, suggesting that the market is trying to determine a bottom, and is a bullish reversal pattern.
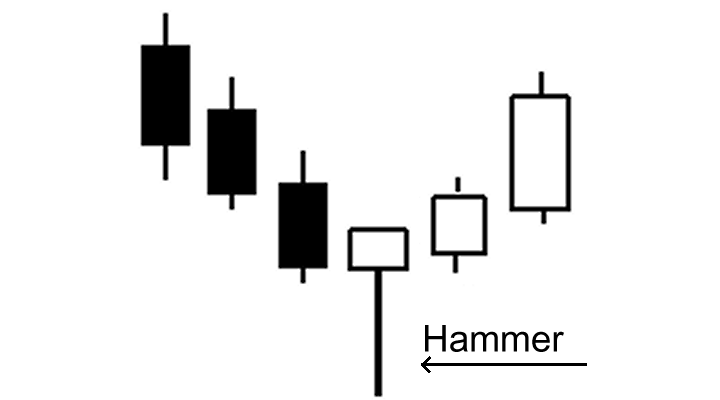
Psychology: Price opens and trades lower as bears are still in control. The bulls then step in to hammer the falling price. However, this does not suggest the end of a downtrend, but simply suggests that bullish investors are strengthening. They try to take the price higher to close near the top of the trading range. Hence a small real body and long shadow.
How to trade: This pattern suggests an upward movement in price. Volume on the hammer day must be higher than previously falling candles. Suggested entry could be after a close above the real body of the hammer. A buy based on this pattern must preferably be supported by a longer term rising trend channel, positive volume balance or other longer term technical indicators. Low of the hammer can be used as a stop-loss on closing basis.
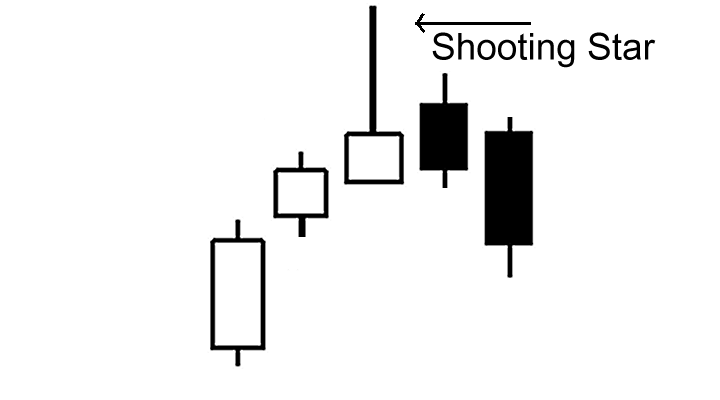
Shooting Star is the reverse pattern of the hammer. It is formed at the top after a prolonged uptrend.
Inverted Hammer
Inverted hammer appears after a decline and is a bottom reversal line. It has a small real body (black or white), a long upper shadow, which must be at least twice the size of the real body, and a very tiny or no lower shadow.
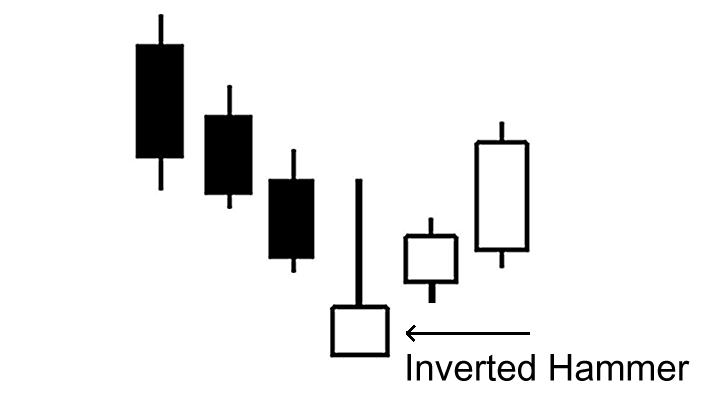
Psychology: The inverted hammer needs bullish confirmation which could be ideal in the form of next days close above the real body of the inverted hammer. The reason for the bullish verification is that it has a long upper shadow that gives the inverted hammer a bearish shade. A close above will, in a way, nullify this bearish effect. This could further lead to the beginning of a rally.
How to trade: This pattern suggests an upward movement in price. Volume on the inverted hammer day or the following candle must be higher than previously falling candles. Suggested entry could be a close above the real body of the inverted hammer. A buy can be initiated based on this pattern, preferably supported by a longer term rising trend channel, positive volume balance or other longer term technical indicators. Low of the inverted hammer can be used as a stop-loss on the closing basis.
Bullish Engulfing
Bullish engulfing is a two-candle bullish reversing pattern. The real body of the first candle is entirely engulfed by the real body of the second candle. The second candles real body is white and first candles is preferably black in color. The first candle must be preceded by falling candles and the pattern is of any significance only after a downtrend. The engulfing candle may or may not have an upper shadow.
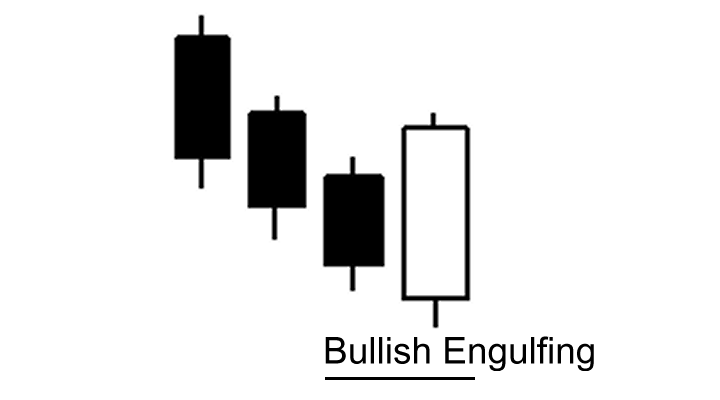
Psychology: Bears have been in charge so far and price opens with a gap down from previous close. Before the end of the day bulls charge in and downtrend runs out of steam. The large body shows that the new direction has started with good force.
How to trade: The engulfing candle must be accompanied by higher volume. The pattern must be followed by a higher top and higher close candle to ensure change in trend. A close above the high of the engulfing pattern suggests a potential buy can be initiated. A close below the low of the pattern can be used as a stop-loss. Any signal is suggested to be supported by a longer term rising trend channel, positive volume balance or other longer term technical indicators.
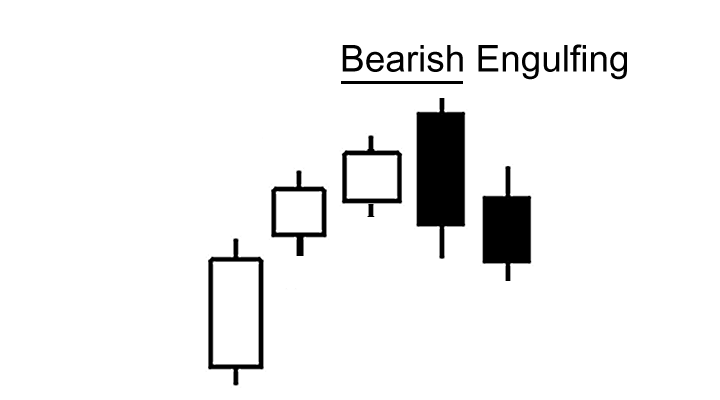
Bearish engulfing is just the opposite of the bullish engulfing pattern mostly appearing at the top of a move.
Bullish Harami
Bullish Harami is a two candle pattern where the second candles real body (black or white) is completely inside the first candles real body. The color of the first candle should ideally be black. This is seen as a trend reversing pattern and comes after a decline in price. The second candle may or may not have a real body.
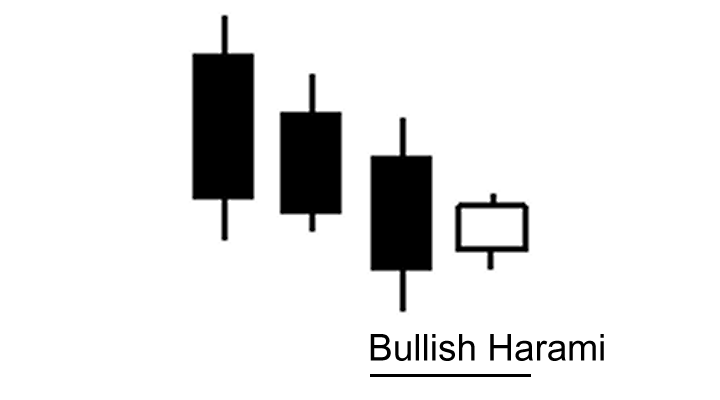
Psychology: This pattern means that the market is losing its breath because the small real body is a sign of uncertainty. The small real bodys opening and close within prior candles real body is another indication that the bears are losing momentum. Thus a trend reversal is possible.
How to Trade: A buy is suggested if the share price closes above the high of the pattern. A close below the pattern triggers the stop-loss. It is suggested that this signal be used in association with a longer term rising trend channel, positive volume balance or other longer term trend reversing or technical indicators.
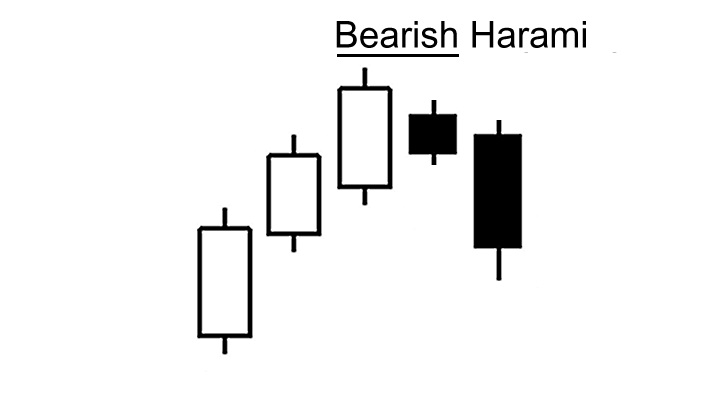
Bearish Harami is the reverse of this pattern and appears after an uptrend. It is a bearish reversal signal.
The Morning Star
The Morning Star is composed of three candles. The first candle has a black real body, second candle is a small candle with small or no real body and tiny shadows, and the third candle has a long white real body. The second candle usually appears outside the real body of the first candle and can be either black or white. It appears after a downward move and is a bullish or bottom reversal pattern.
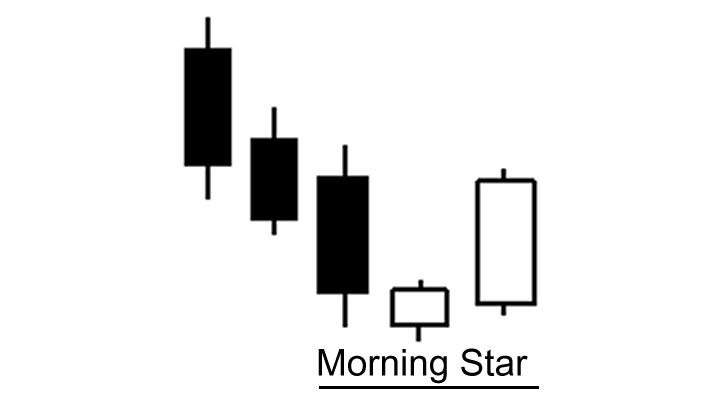
Psychology: The first black candle is a continuation of a falling trend. Second candle represents indecision between bulls and bears and the market is losing its prior directional bias. Hence a small real body. The third candle is a long white candle which defines that the bulls are trying to overpower the bears and ready to take charge of an upcoming uptrend. Ideally the real body of the white candle should close more than halfway into the first candles real body.
How to trade: The morning star is used as an early indication that the down move is about to reverse, but this trend reversing pattern is suggested to be seen together with a longer term rising trend channel, positive volume balance or other technical indicators to confirm the change in trend. The low of the pattern, which is the low of the middle candle, can be used as the stop-loss on closing basis to come out of the stock.
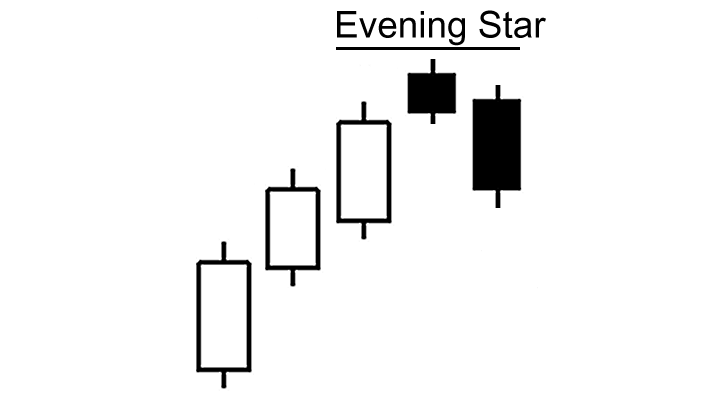
Evening Star: Reverse formation of the morning star is called the evening star. It appears after an uptrend and is a top or bearish reversal pattern.
Piercing Line
Piercing line is composed of two candles and is a bullish or bottom reversal pattern if it appears after a downtrend or series of falling candles. The first candle is a black real body and the second candle is a white real body. On the second day price opens with a gap down and travels higher to close more than halfway into the body of the first candle, but does not cross its entire real body.
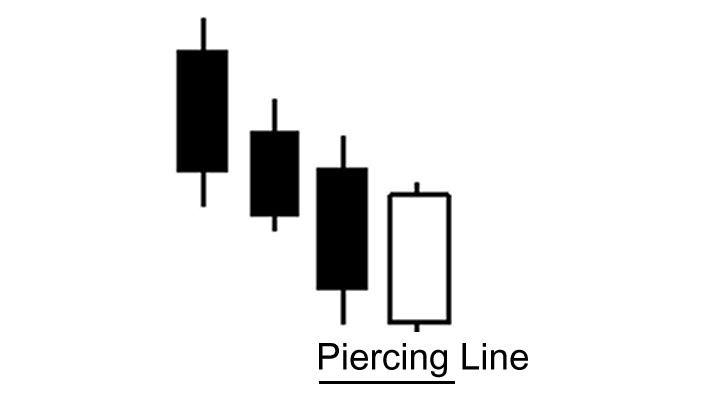
Psychology: Bears are content with the reinforced downtrend. Next day price opens with the gap down, but eventually starts to inch upwards as bulls start to step in. Price manages to rise half way through the previous candle's real body and closes above its close. This leaves the bears in confusion. Opportunist buyers say new lows could not hold and view this as a chance to get in.
How to trade: This pattern must be confirmed by another candle closing above the close of the piercing candle. Suggested volume on the second candle must be higher. A stop-loss on closing basis below the low of the pattern is suggested. A buy based on this pattern should be supported by a longer term rising trend channel, positive volume balance or other longer term technical indicators.
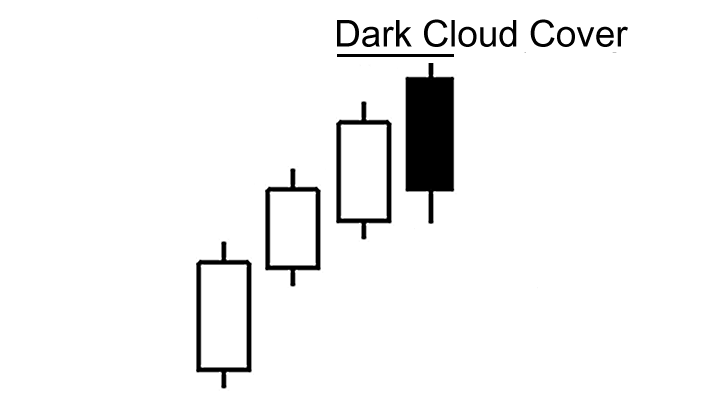
Dark Cloud Cover: Reverse of the piercing line pattern is the dark cloud cover. It is a bearish reversing pattern and appears after an uptrend. All the properties are similar to the piercing line pattern but in reverse manner. This pattern can be used to get out of the stock to avoid any possible loss in existing holding due to any downward move.
Windows
Windows or Gaps (as it is called in Western methods) are of two types, bullish or bearish. A rising window is a bullish signal. There is a price vacuum between the prior sessions high and current sessions low. The trading session followed by the window is usually accompanied by higher volume.
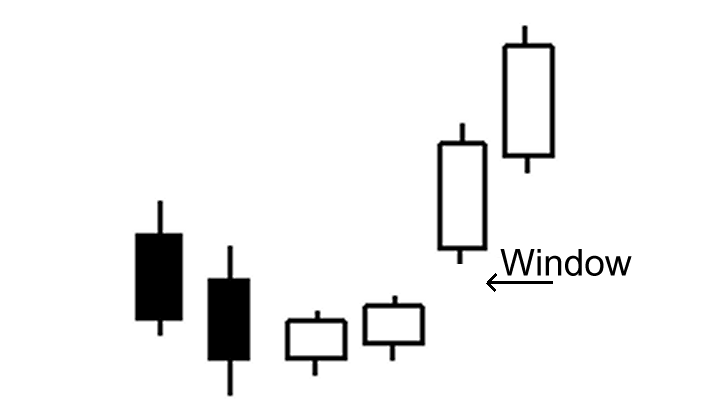
Psychology: A window appears when there is sudden optimism in the market. It is created either by some market news that had come overnight, or driven by high optimism among buyers that take the price higher.
How to trade: A rising window must be confirmed by successive rising candle or candles in the upward direction. Further, it always acts as a support in an uptrending market. However, any price close below the bottom of a rising window is interpreted as a sign of weakness. A close below this level is where one may stop any loss in the stock and get out of the stock.
It is suggested not to trade windows in isolation, but in combination with long term trend channel, volume balance or other longer term supportive technical indicators.
Three Advancing White Soldiers
Three Advancing White Soldiers is seen as both a bullish reversal (when appears after a downward trend) as well as a continuation candle pattern (appears after a consolidation phase in an uptrend). It comprises of three advancing candles which has higher closes. Each line is a long white candle with prices closing near their highs.
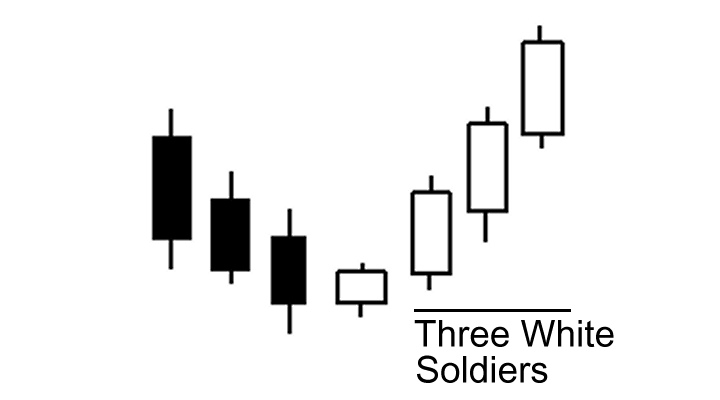
Psychology: This pattern is a sign of strength and change in investor sentiment, and it confirms a shift in momentum if it appears at a low price area or after a period of stable prices.
How to trade:This is a rare pattern. However, when it appears, a short move upward after a breakout from this pattern is common. One can buy based on this formation with a strict stop-loss on closing basis below the low of the very first candle of the three candles. It is recommended to see this candlestick signal along with a longer term rising trend channel, positive volume balance or other longer term suggestive technical indicators.
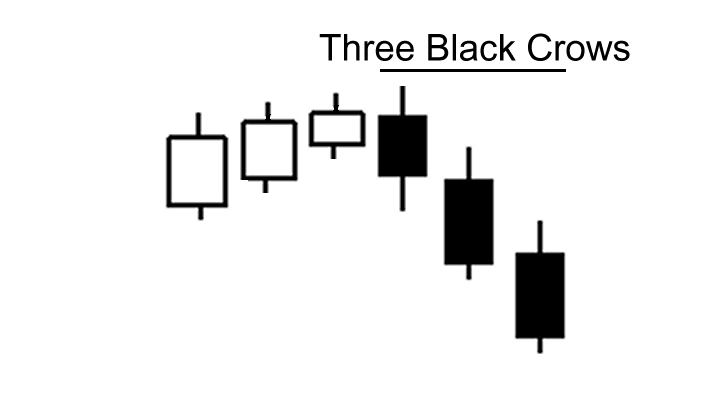
Three Black Crows is the opposite candlestick pattern of the three white soldiers. It either occurs after an uptrend to mark weakening of the uptrend and a possible reversal, or shows after a consolidation phase in a preceeding downtrend.
Investtech guarantees neither the entirety nor accuracy of the analyses. Any consequent exposure related to the advice / signals which emerge in the analyses is completely and entirely at the investors own expense and risk. Investtech is not responsible for any loss, either directly or indirectly, which arises as a result of the use of Investtechs analyses. Details of any arising conflicts of interest will always appear in the investment recommendations. Further information about Investtechs analyses can be found here disclaimer.
The content provided by Investtech.com is NOT SEC or FSA regulated and is therefore not intended for US or UK consumers.
Head office
Strandveien 171366 Lysaker, Norway
Research department
Instituttveien 102007 Kjeller, Norway