Results analysis
Investtech’s analysis of results publication gives an overview of price development in the company the days before and after publication of quarterly results. Some companies seem to systematically give positive or negative surprises or are characterized by investors acting a certain way around results publication. These analyses provide the opportunity to reveal such correlations and use them to get in position prior to results publication. Does a company almost always rise before publication, or does it rise afterwards? Note that results publication always carries high risk of surprises, so the probability of great price movements, up and down, is much higher than usual.
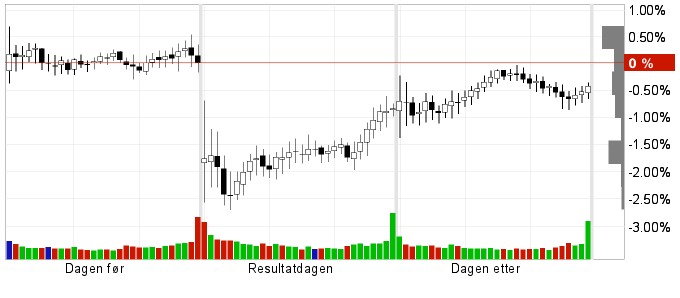
Results publication: intraday movements

The chart shows the stock’s average development the day before results publication, the day of publication and the day after publication. The example shows a stock where the price historically opens down, but then catches up during the day of and the day after publication.
There are two sets of charts on the Results Analysis page. The top set are charts for the past five results publications and the bottom set are for the past twenty. If a stock has short history on the Exchange, statistics for fewer data are shown.
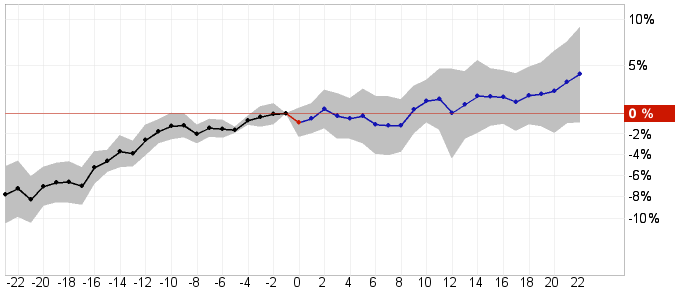
Results publication: monthly movements

The chart shows average price development from the month before to the month after results publication. The results are published on day 0 in the chart, and price development on this day is shown in red. The shaded area is one standard deviation.
Statistical development and base data
Specific return is shown in the table below the charts. The average figures are shown first and then the individual data. There is often great variation from one results publication to the next. Inspecting the table will provide the details. At the bottom of the page are charts with the development for each results publication. Click the plus icon to see these.
Results publications in the price chart

Results publications are plotted in blue dots in the price chart. The chart shows results publications in the past 18 months.
Investtech guarantees neither the entirety nor accuracy of the analyses. Any consequent exposure related to the advice / signals which emerge in the analyses is completely and entirely at the investors own expense and risk. Investtech is not responsible for any loss, either directly or indirectly, which arises as a result of the use of Investtechs analyses. Details of any arising conflicts of interest will always appear in the investment recommendations. Further information about Investtechs analyses can be found here disclaimer.
The content provided by Investtech.com is NOT SEC or FSA regulated and is therefore not intended for US or UK consumers.


 Oslo Børs
 Stockholmsbörsen
 Københavns Fondsbørs
 Helsingin pörssi
 World Indices
 US Stocks
 Toronto Stock Exchange
 London Stock Exchange
 Euronext Amsterdam
 Euronext Brussel
 DAX
DAX CAC 40
 Mumbai S.E.
 Commodities
 Currency
 Cryptocurrency
 Exchange Traded Funds
 Investtech Indices
