
 Oslo Børs
 Stockholmsbörsen
 Københavns Fondsbørs
Investeringsforeninger
Københavns Fondsbørs
Investeringsforeninger
 Helsingin pörssi
 World Indices
 US Stocks
US 30
Nasdaq 100
US 500
US Stocks
US 30
Nasdaq 100
US 500
 Toronto Stock Exchange
 London Stock Exchange
 Euronext Amsterdam
 Euronext Brussel
 DAX
SDAX
TECDAX
Frankfurt
CDAX
MDAX
Prime Standard
DAX
SDAX
TECDAX
Frankfurt
CDAX
MDAX
Prime Standard
 CAC 40
 Mumbai S.E.
National S.E.
Mumbai S.E.
National S.E.
 Commodities
 Currency
 Cryptocurrency
 Exchange Traded Funds
 Investtech Indices
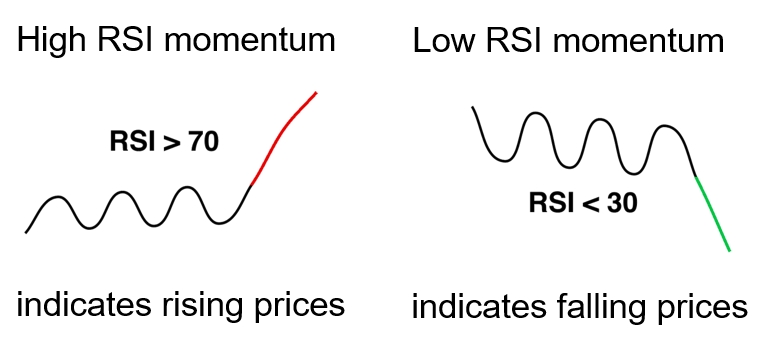
RSI is a good momentum indicator
Published 19 February 2019
A research report from Investtech based on 12 years of data from the National Stock Exchange in India shows that stocks with high RSI, above the critical 70 level, have continued to rise. Similarly stocks with low RSI, below the critical 30 level, have continued to underperform vs benchmark.
RSI is an oft-used indicator in technical analysis. RSI means Relative Strength Index, and it measures how well a stock has performed compared to itself. The figure is calculated by looking at the strength of days with rising prices compared to strength of days with falling prices over a certain period of time and it gets a value between 0 and 100.
Many investors feel that RSI indicates whether a stock has risen or fallen too much and will react back. Investtechs research shows that this overbought/oversold interpretation is not statistically correct. The results show that RSI is a good indicator of whether the stock has positive momentum or negative momentum and that this RSI momentum is a good indicator of future price development.
We have studied 31,220 cases where RSI21 crossed above the 70 limit and 23,404 cases where RSI21 fell below the 30 limit. We called this strategy RSI momentum and called it a buy signal when RSI went above 70 and a sell signal when RSI fell below 30.
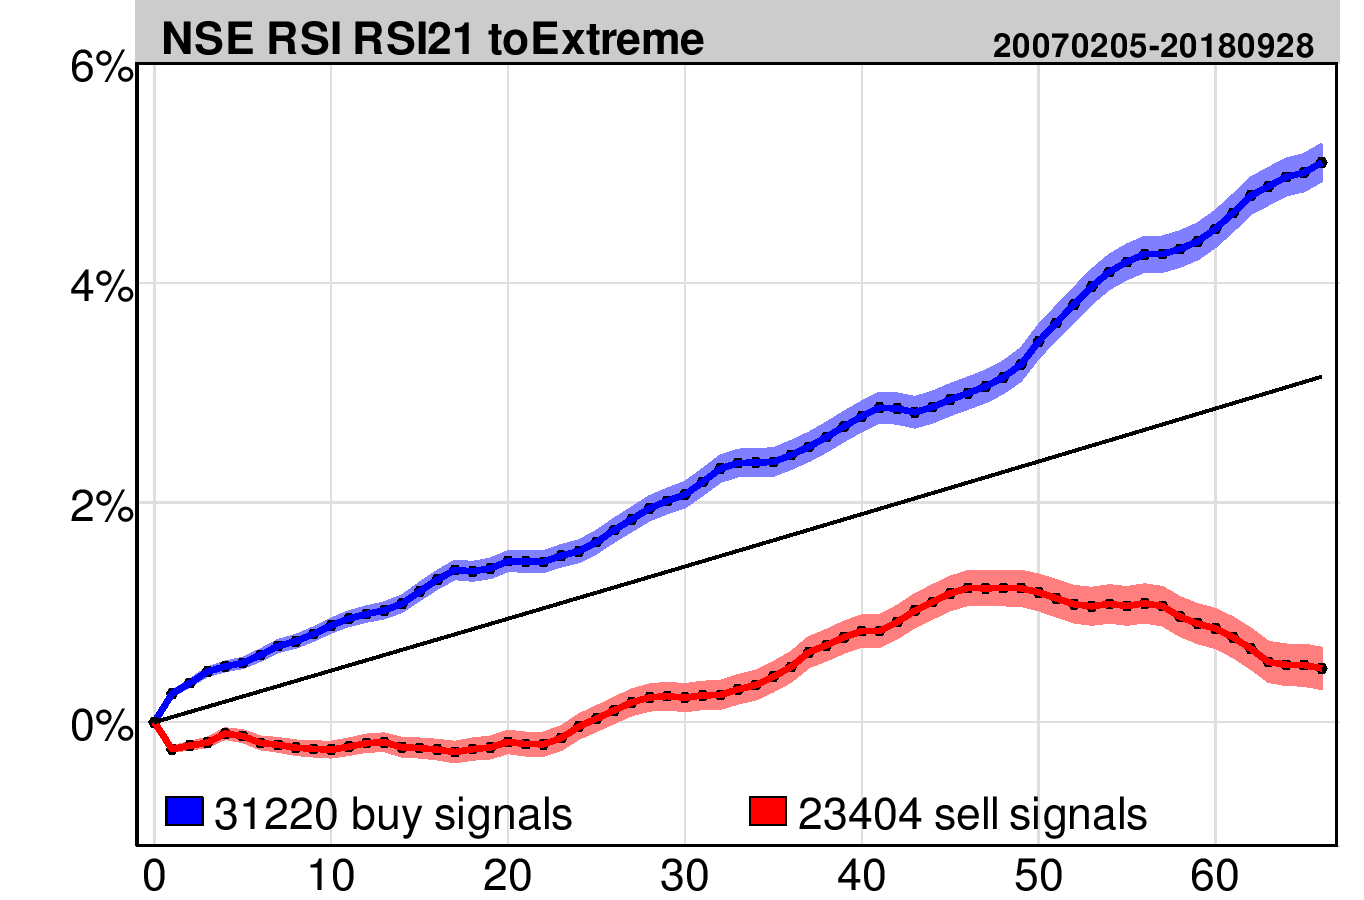
The chart shows price development the first 66 days after RSI momentum signals compared to benchmark development in the period. Blue line is buy signals, red line is sell signals and black is benchmark index.
The table below shows annualized excess return following RSI momentum signals. The figures are based on the quarterly figures, i.e. excess return 66 days (3 months) after the signal was triggered.
| Annualized excess return | |
| Buy signal RSI21 breaks above 70 | 9.0 %p |
| Sell signal RSI21 breaks below 30 | -10.9 %p |
%p: percentage points
The results indicate that RSI is a well-suited momentum indicator and that investments based on buy signals from RSI momentum give statistically stronger return than average benchmark.
Investtech offers a number of stock picking tools, and using Stock selection you can set criteria for RSI, allowing you to find for instance all stocks with RSI above 70. You can also set criteria for liquidity and volatility.
Please find more research results and details in the complete research report here.
Keywords: Buy signal,NSE,RSI,RSI-momentum,Sell signal,statistics.
Written by

Head of Research and Analysis
at Investtech
Insight & Skills:
Pro tip:
Stock selection
Using the tool Stock selection you can set criteria for RSI, allowing you to screen all stocks with RSI above 70 and liquidity of your choice.
"Investtech analyses the psychology of the market and gives concrete trading suggestions every day."

Partner & Senior Advisor - Investtech


Investtech guarantees neither the entirety nor accuracy of the analyses. Any consequent exposure related to the advice / signals which emerge in the analyses is completely and entirely at the investors own expense and risk. Investtech is not responsible for any loss, either directly or indirectly, which arises as a result of the use of Investtechs analyses. Details of any arising conflicts of interest will always appear in the investment recommendations. Further information about Investtechs analyses can be found here disclaimer.
The content provided by Investtech.com is NOT SEC or FSA regulated and is therefore not intended for US or UK consumers.
Head office
Strandveien 171366 Lysaker, Norway
Research department
Instituttveien 102007 Kjeller, Norway