
 Oslo Børs
 Stockholmsbörsen
 Københavns Fondsbørs
Investeringsforeninger
Københavns Fondsbørs
Investeringsforeninger
 Helsingin pörssi
 World Indices
 US Stocks
US 30
Nasdaq 100
US 500
US Stocks
US 30
Nasdaq 100
US 500
 Toronto Stock Exchange
 London Stock Exchange
 Euronext Amsterdam
 Euronext Brussel
 DAX
SDAX
TECDAX
Frankfurt
CDAX
MDAX
Prime Standard
DAX
SDAX
TECDAX
Frankfurt
CDAX
MDAX
Prime Standard
 CAC 40
 Mumbai S.E.
National S.E.
Mumbai S.E.
National S.E.
 Commodities
 Currency
 Cryptocurrency
 Exchange Traded Funds
 Investtech Indices
Three buy signals, strong momentum and positive volume balance
Published May 29, 2019
Nifty 50 (NIFTY) moved more or less horizontally on Tuesday and closed at 11928.75 points (+0.03 per cent). Of 1906 listed stocks on NSE, 975 stocks advanced while 824 declined and 107 were unchanged, leaving the advance to decline ratio (AD ratio) biasing slightly towards the bullish side. The AD ratio is a sentiment indicator that broadly suggests if the buyers' sentiment is dominant or the sellers'.
Other indicators are volume indicators and momentum indicators that we usually cover in our analysis. In our article today, our focus is to choose stocks that are favoured by buyers, or to say stocks that are supported by a strong volume based indicator, called volume balance, and the momentum indicator RSI. We will elaborate more on the volume balance indicator in our next article.
How did we select stocks today? We went through our 'stock selection' criteria and set limits. In this case we set momentum value to be above 65, volume balance over 40 and only stocks with turnover of 1000 million rupees or above. We look at three stocks out of 21 for you. You can get your preferred list of all stocks by playing around and trying different permutations and combinations of the selection criteria.
The Federal Bank Limi (FEDERALBNK.NS) Close: 107.55
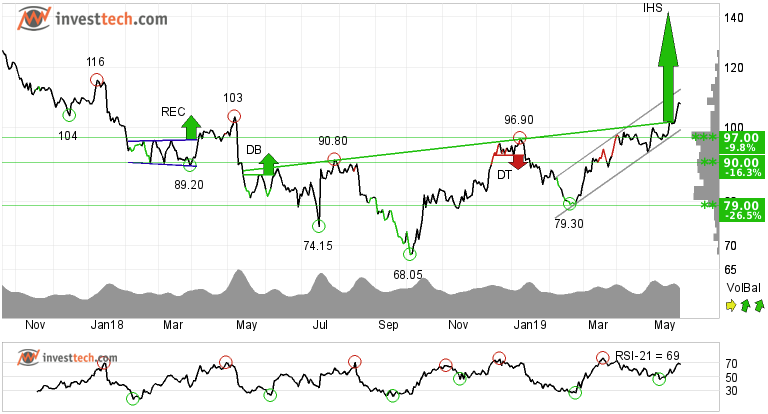
The Federal Bank Limited is in a rising trend channel both in the medium and long term. This signals increasing optimism among investors. The stock has given a positive signal from an inverse head and shoulders formation by a break up through the resistance at 102 rupees. Further rise to 142 or more is signalled. The stock has support at rupee 97 and 90 rupees.
The volume balance is positive, as indicated by the rising green arrows in the bottom right part of the price chart. The short term momentum of the stock is strongly positive, with RSI above 70. This indicates increasing optimism among investors and further price increase for The Federal Bank Limited.
Recommendation one to six months: Positive
State Bank of India (SBIN.NS) Close: 360.05
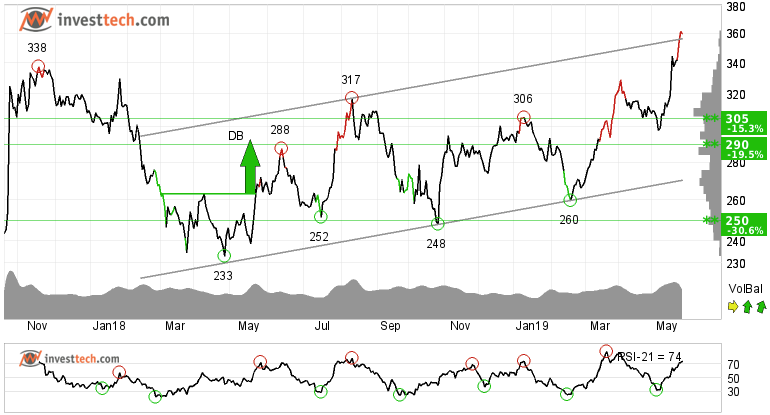
Investors have paid higher prices over time to buy State Bank of India and the stock has broken through the ceiling of the rising trend channel in the medium term. Further rise in the stock price is suggested.
The stock touched its all time high last week and closed near that level on Tuesday. Hence the stock is in a new price territory. There is support around 329 rupees.
RSI above 70 shows that the stock has strong positive momentum in the short term, indicating increasing optimism among investors. Positive volume balance strengthens the underlying strength in the stock, as more buyers are now interested in the stock. The stock is overall assessed as technically positive for the medium term.
Recommendation one to six months: Positive
Bharat Electronics Lim (BEL.NS) Close: 112.75
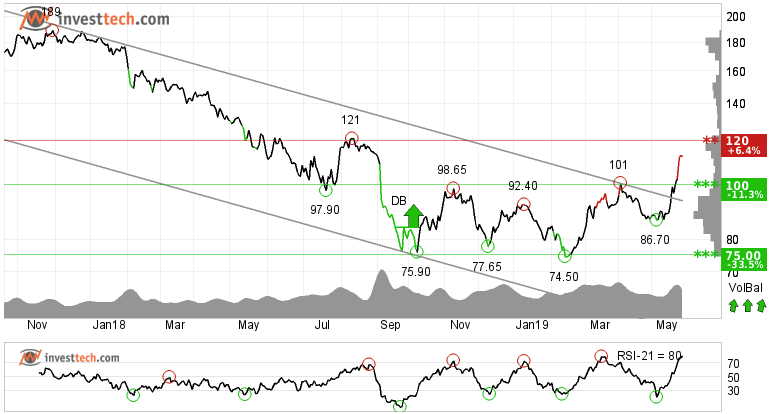
Bharat Electricals Limited has broken above through the ceiling of the falling trend channel both in the medium and long term. In the first place, breakout from a falling trend channel suggests a falling rate of decline in price or development of a sideways trend.
However, in this case the resistance at 100 rupees is broken which is now the support. This is a sign of strength and indicates that buyers are now interested to be invested in the stock. Established higher tops and bottoms may lead to a new rising trend. Next resistance is around 120 rupees. A break above that level may initiate fresh buying in the stock.
Positive volume balance and rising momentum with RSI value above 70 strengthen the stock in the short to medium term. Further rise in stock price is suggested.
Recommendation one to six weeks: Positive
The analyses are based on closing price as per May 28, 2019. Maintaining proper stop loss is always recommended.
Written by

Analyst - Investtech
Archive:
20 May: Two buy and one interesting to watch
6 May: This banking stock has gone up by 20% in the last six months
2 May: Three exciting buy opportunities - Price breakouts
24 April: Exclusive research report: Rectangles and return from breakouts
17 April: Stock with 20 per cent upside potential
11 April: Three buy opportunities, price-volume breakout
29 March: Two stocks to stay from
27 March: Recent breakouts in three stocks, short term opportunity
21 March: Three buy and one sell
12 March: Cement stocks are posing good opportunity
08 March: Clear breakout and reversal from intermediate downtrend
07 March: Deepak Nitrite Limited looks promising to enter into a trade
06 March: Three buy candidates for medium to long term
28 February: Breakout in these three stocks invites for early opportunity
26 February: Two buy opportunities for the near term future
21 February: Stocks with RSI above 70, based on our research
19 February: Close to selling point, time to be cautious
15 February: These two sugar stocks look promising
14 February: Three short to medium term opportunities
08 February: One buy and one sell in stocks while index suggests caution
06 February: One buy and one sell, short to medium term opportunities
01 February: Upside breakout from price formations
30 January: Buying opportunity: Reversing from trend channel support
9 January: One positive and one to stay away from
2 January: A good investment opportunity
2018
21 December: Good buying opportunities
14 December: Positive on these three stocks
11 December: One buy and one sell signal
07 December: Sell Signals in Three Big Stocks
04 December: Highest scorer of our Top 50 list
30 November: Positive stocks with 5-11 per cent upside potential
28 November: Buy signal on high volume
27 November: One Buy and One Sell Signal
23 November: Fear dominates these stocks
21 November: Sell signal, time to stay away
20 November: Early opportunity from short term buy signal?
16 November: Two Buy Signals and One Sell Signal
15 November: Buy signal in this one
13 November: Big auto stocks comparison
09 November: What to wait for?
06 November: Banking stocks look positive
02 November: Positive on this one
01 November: TECHM, NIFTY50 and Hausse
31 October: What are investors thinking?
30 October: Bullish on these three stocks
26 October: Three potential candidates to ride on
24 October: Three big Metal stocks, Seasonal variation
22 October: Among top performers on our Top 50 list
18 October: Three stocks investors should stay away from
17 October: Flowing against the tide
16 October: Positive on these 2 stocks
11 October: Over 45 per cent rise
9 October: The Indian banking space
5 October: Nifty closes at a crucial level
2 October: Price formations in the long-term charts
28 September: Positive on Biocon Limited
"Investtech analyses the psychology of the market and gives concrete trading suggestions every day."

Partner & Senior Advisor - Investtech


Investtech guarantees neither the entirety nor accuracy of the analyses. Any consequent exposure related to the advice / signals which emerge in the analyses is completely and entirely at the investors own expense and risk. Investtech is not responsible for any loss, either directly or indirectly, which arises as a result of the use of Investtechs analyses. Details of any arising conflicts of interest will always appear in the investment recommendations. Further information about Investtechs analyses can be found here disclaimer.
The content provided by Investtech.com is NOT SEC or FSA regulated and is therefore not intended for US or UK consumers.
Head office
Strandveien 171366 Lysaker, Norway
Research department
Instituttveien 102007 Kjeller, Norway