
 Oslo Børs
 Stockholmsbörsen
 Københavns Fondsbørs
Investeringsforeninger
Københavns Fondsbørs
Investeringsforeninger
 Helsingin pörssi
 World Indices
 US Stocks
US 30
Nasdaq 100
US 500
US Stocks
US 30
Nasdaq 100
US 500
 Toronto Stock Exchange
 London Stock Exchange
 Euronext Amsterdam
 Euronext Brussel
 DAX
SDAX
TECDAX
Frankfurt
CDAX
MDAX
Prime Standard
DAX
SDAX
TECDAX
Frankfurt
CDAX
MDAX
Prime Standard
 CAC 40
 Mumbai S.E.
National S.E.
Mumbai S.E.
National S.E.
 Commodities
 Currency
 Cryptocurrency
 Exchange Traded Funds
 Investtech Indices
Morning Report Apr 11, 2024
Watch: NASDAQ
Buy: TORONTO SYDNEY WELLING PSI20
Weak buy: SINGAPO
Sell: SSEC
Watch: NYA
NASDAQ (Price Apr 10, 2024: 16170)Watch
Watch
 NASDAQ has broken the floor of the rising trend channel in the medium long term, which indicates a weaker initial rising rate. The index is testing resistance at points 16400. This could give a negative reaction, but an upward breakthrough of points 16400 means a positive signal. RSI diverges negatively against the price, which indicates danger of a reaction downwards. The index is overall assessed as technically neutral for the medium long term.
Extended analysis
Toronto (Price Apr 10, 2024: 22199)Buy
Buy
 Toronto is in a rising trend channel in the medium long term. Rising trends indicate that the market experiences positive development and that buy interest among investors is increasing. There is no resistance in the price chart and further rise is indicated. In case of a negative reaction, the index has support at approximately 20660 points. The index is assessed as technically positive for the medium long term.
Extended analysis
Sydney (Price Apr 10, 2024: 8074.10)Buy
Buy
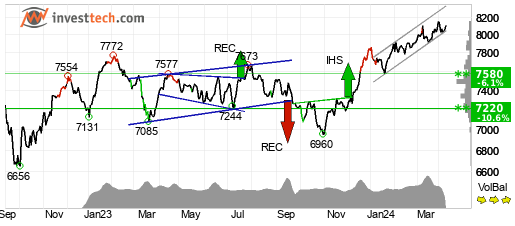 Sydney has broken through the floor of a rising trend channel in the medium long term. This indicates a slower rising rate at first, or the start of a more horizontal development. There is no resistance in the price chart and further rise is indicated. In case of a negative reaction, the index has support at approximately 7580 points. The index is assessed as technically positive for the medium long term.
Extended analysis
Wellington (Price Apr 10, 2024: 11934)Buy
Buy
 Wellington has broken through the floor of a rising trend channel in the medium long term. This indicates a slower rising rate at first, or the start of a more horizontal development. The index is testing support at points 11930. This could give a positive reaction, but a downward breakthrough of points 11930 means a negative signal. Volume has previously been high at price tops and low at price bottoms. This weakens the trend break. The index is overall assessed as technically positive for the medium long term.
Extended analysis
Euronext PSI20 (Price Apr 10, 2024: 6279.78)Buy
Buy
 Euronext PSI20 is in a rising trend channel in the medium long term. Rising trends indicate that the market experiences positive development and that buy interest among investors is increasing. The price has reacted back after the break of the rectangle formation. There is support around 6222, which now indicates good buying opportunities. An established break through this support will neutralize the positive signal. However, the index has received a negative signal from the moving average indicator, thus signaling a continued fall. The index has broken up through resistance at points 6230. This predicts a further rise. In case of negative reactions, there will now be support at points 6230. The index is overall assessed as technically positive for the medium long term.
Extended analysis
Singapore - Straits Times (Price Apr 10, 2024: 3225.26)Weak buy
Weak buy
 Singapore - Straits Times is in a falling trend channel in the medium long term. Falling trends indicate that the market experiences negative development and falling buy interest among investors. It also gave positive signal from the inverse head and shoulders formation at the break up through the resistance at 3208. Further rise to 3403 or more is signaled. The index has received a positive signal from the moving average indicator, thus signaling a continued rise. The index is testing resistance at points 3240. This could give a negative reaction, but an upward breakthrough of points 3240 means a positive signal. The RSI curve shows a rising trend, which is an early signal of a possible trend reversal upwards for the price as well. The index is overall assessed as technically slightly positive for the medium long term.
Extended analysis
Shanghai Composite (Price Apr 10, 2024: 3034.25)Sell
Sell
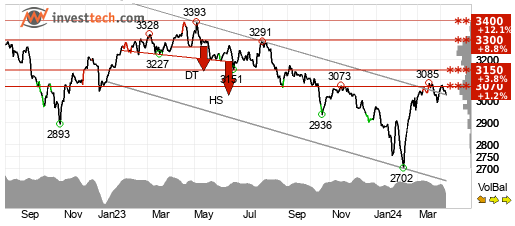 Shanghai Composite has broken through the ceiling of a falling trend channel in the medium long term. This indicates a slower falling rate initially, or the start of a more horizontal development. The index is approacing resistance at 3070 points, which may give a negative reaction. However, a break upwards through 3070 points will be a positive signal. The index is assessed as technically negative for the medium long term.
Extended analysis
NYSE Composite (Price Apr 10, 2024: 17947)Watch
Watch
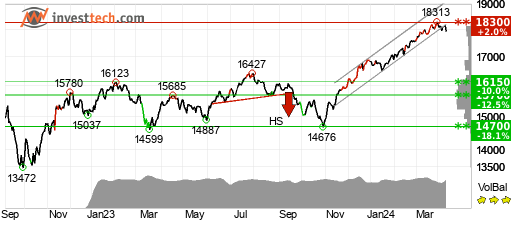 NYSE Composite has broken through the floor of a rising trend channel in the medium long term. This indicates a slower rising rate at first, or the start of a more horizontal development. The index is approacing resistance at 18300 points, which may give a negative reaction. However, a break upwards through 18300 points will be a positive signal. The index is assessed as technically neutral for the medium long term.
Extended analysis
The report consists of daily evaluations by Investtech´s automated analysis system. The selection is mainly based on new medium term technical signals from the last closing price.


Investtech guarantees neither the entirety nor accuracy of the analyses. Any consequent exposure related to the advice / signals which emerge in the analyses is completely and entirely at the investors own expense and risk. Investtech is not responsible for any loss, either directly or indirectly, which arises as a result of the use of Investtechs analyses. Details of any arising conflicts of interest will always appear in the investment recommendations. Further information about Investtechs analyses can be found here disclaimer.
The content provided by Investtech.com is NOT SEC or FSA regulated and is therefore not intended for US or UK consumers.
Head office
Strandveien 171366 Lysaker, Norway
Research department
Instituttveien 102007 Kjeller, Norway
×
