
 Oslo Børs
 Stockholmsbörsen
 Københavns Fondsbørs
Investeringsforeninger
Københavns Fondsbørs
Investeringsforeninger
 Helsingin pörssi
 World Indices
 US Stocks
US 30
Nasdaq 100
US 500
US Stocks
US 30
Nasdaq 100
US 500
 Toronto Stock Exchange
 London Stock Exchange
 Euronext Amsterdam
 Euronext Brussel
 DAX
SDAX
TECDAX
Frankfurt
CDAX
MDAX
Prime Standard
DAX
SDAX
TECDAX
Frankfurt
CDAX
MDAX
Prime Standard
 CAC 40
 Mumbai S.E.
National S.E.
Mumbai S.E.
National S.E.
 Commodities
 Currency
 Cryptocurrency
 Exchange Traded Funds
 Investtech Indices
Stocks in rising trends have given excess return in the Nordic markets
Published 18 March 2019
A new research report from Investtech based on 23 years of data from the Oslo Stock Exchange in Norway and 16 years of data from Sweden, Denmark and Finland shows that stocks with buy signal from rising trend on average have risen by 4.9 % in three months, while stocks with sell signal from falling trend have risen by 0.6 %
Trends are one of the most important elements of technical analysis. They are visual and intuitive and describe in which direction a stock is moving. A rising trend indicates lasting and increasing optimism among investors, often as a result of a great deal of positive news about the stock.
Identifying a trend requires studying the price movements. Stock prices rarely move in a straight line. Instead they move in a series of tops and bottoms. Drawing a straight line through two or more rising bottoms produces the support line in a rising trend. See figure 1. Continue to draw a line parallel to the support line through the rising tops. This line is called the trends resistance line. Support and resistance lines combined make up the trend, see figure 2.
Figure 1. Support line in a rising trend.
Figure 2. Rising trend with support line and resistance line.
Similarly, a falling trend is produced when a straight line can be drawn through two or more falling tops and a parallel line through falling bottoms.
Many investors identify trends by studying charts and drawing trend lines by hand. This method has many weaknesses, the most important of which is that it is subjective. You see the trends you want to see and which perhaps fit your own subconscious preferences. It is also a very time consuming method. Investtech has developed automatic algorithms for identification of trends. Every day these algorithms identify the best trend in the chart, on criteria such as distance between the trends support and resistance lines and the number of data points near these lines. Roughly 80,000 various trend alternatives are assessed each day for a medium term Investtech chart with 18 months of historical data. These are given a score and the best trend is selected.
Investtech's Analyst and Senior Researcher Asbjørn Taugbøl has studied price development following buy and sell signals from rising and falling trends respectively on the stock exchanges in Norway, Sweden, Denmark and Finland since 1996, 2003, 2005 and 2007 respectively.
Investtech's computers identified a total of 45,958 buy signals and 26,943 sell signals in the period.
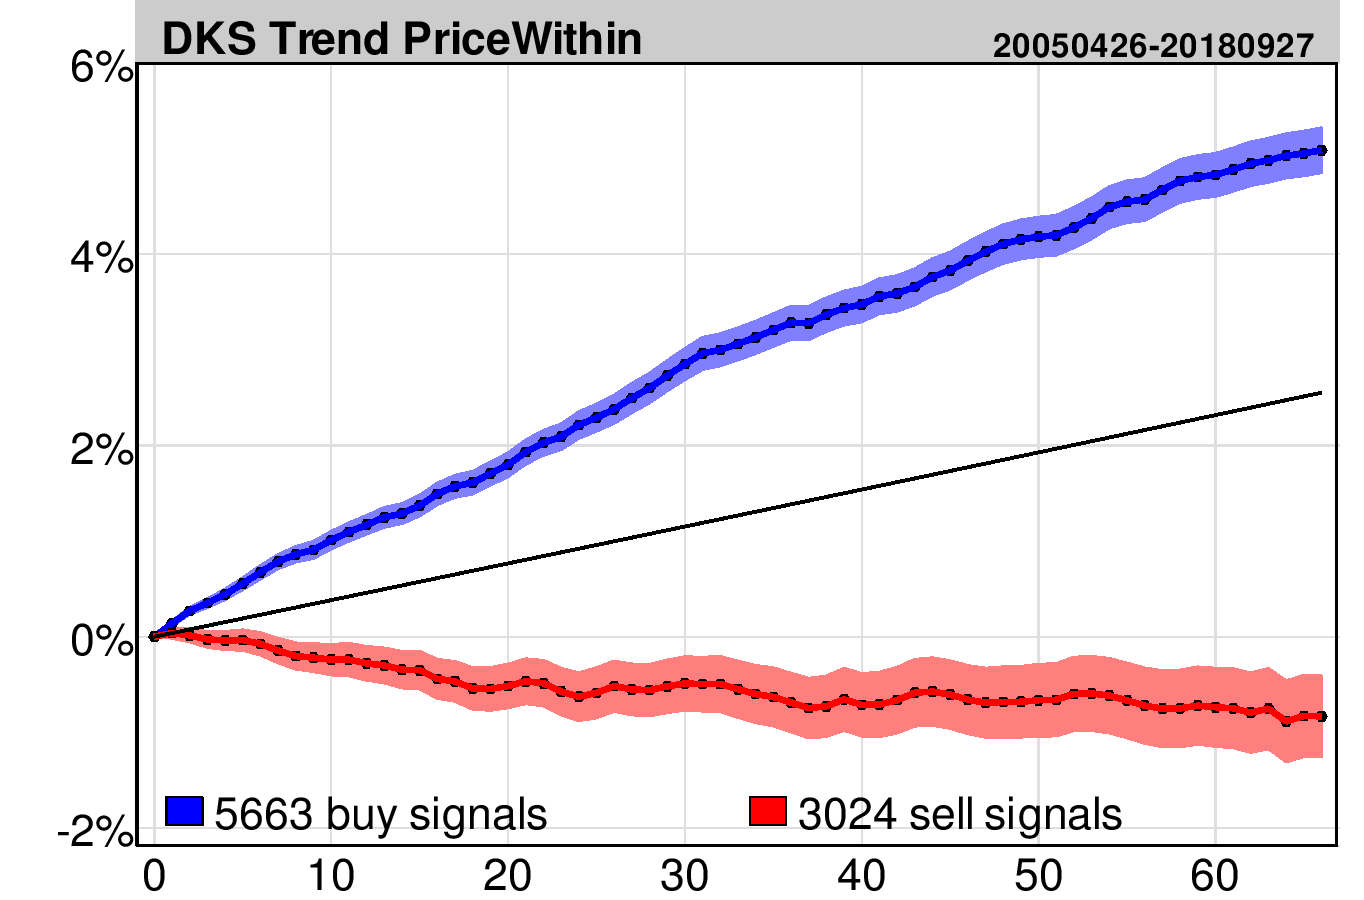
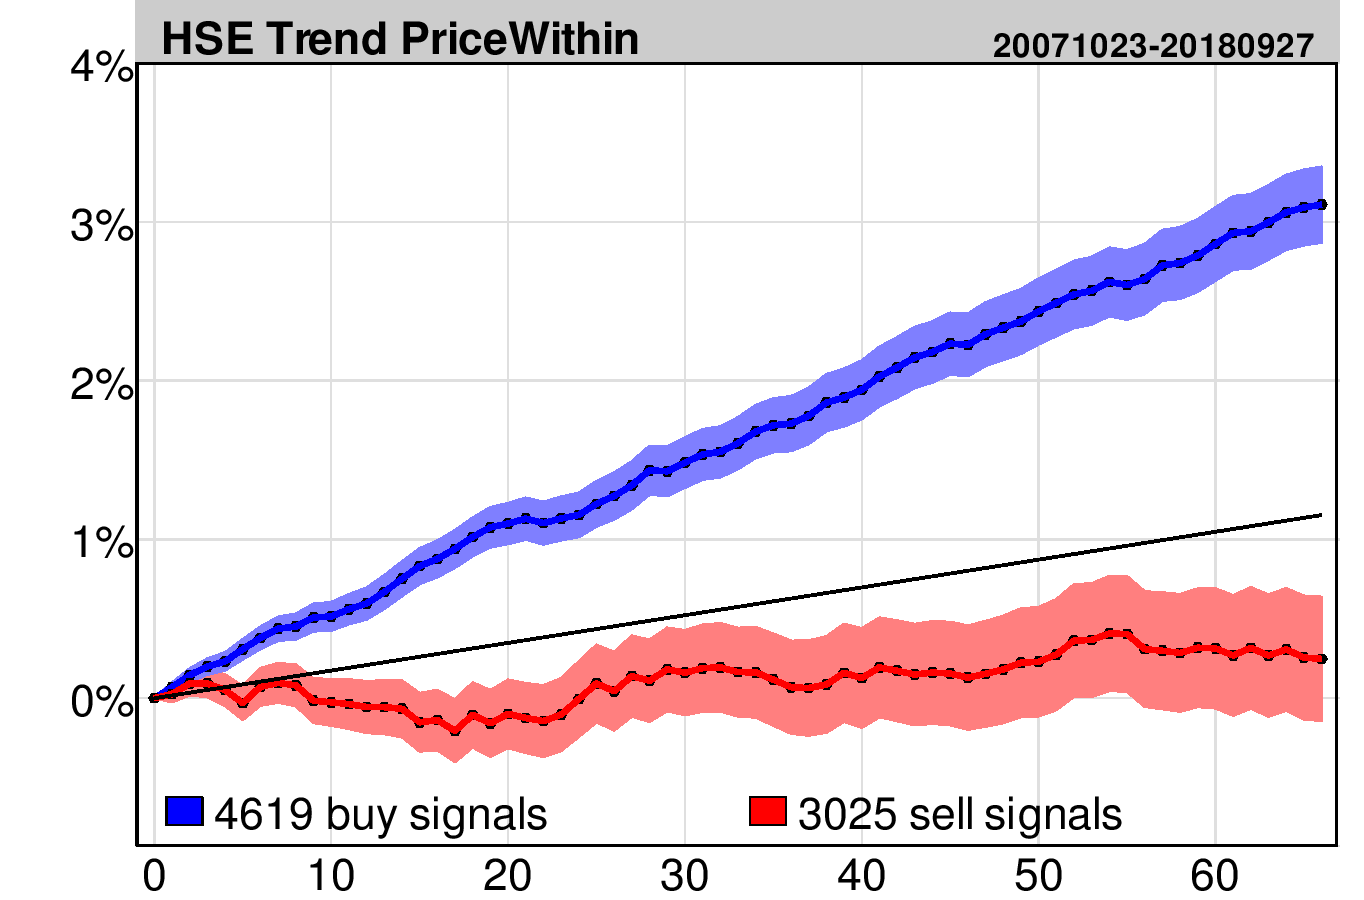
Price development first 66 days (3 months) after trend signals in the Nordic markets:
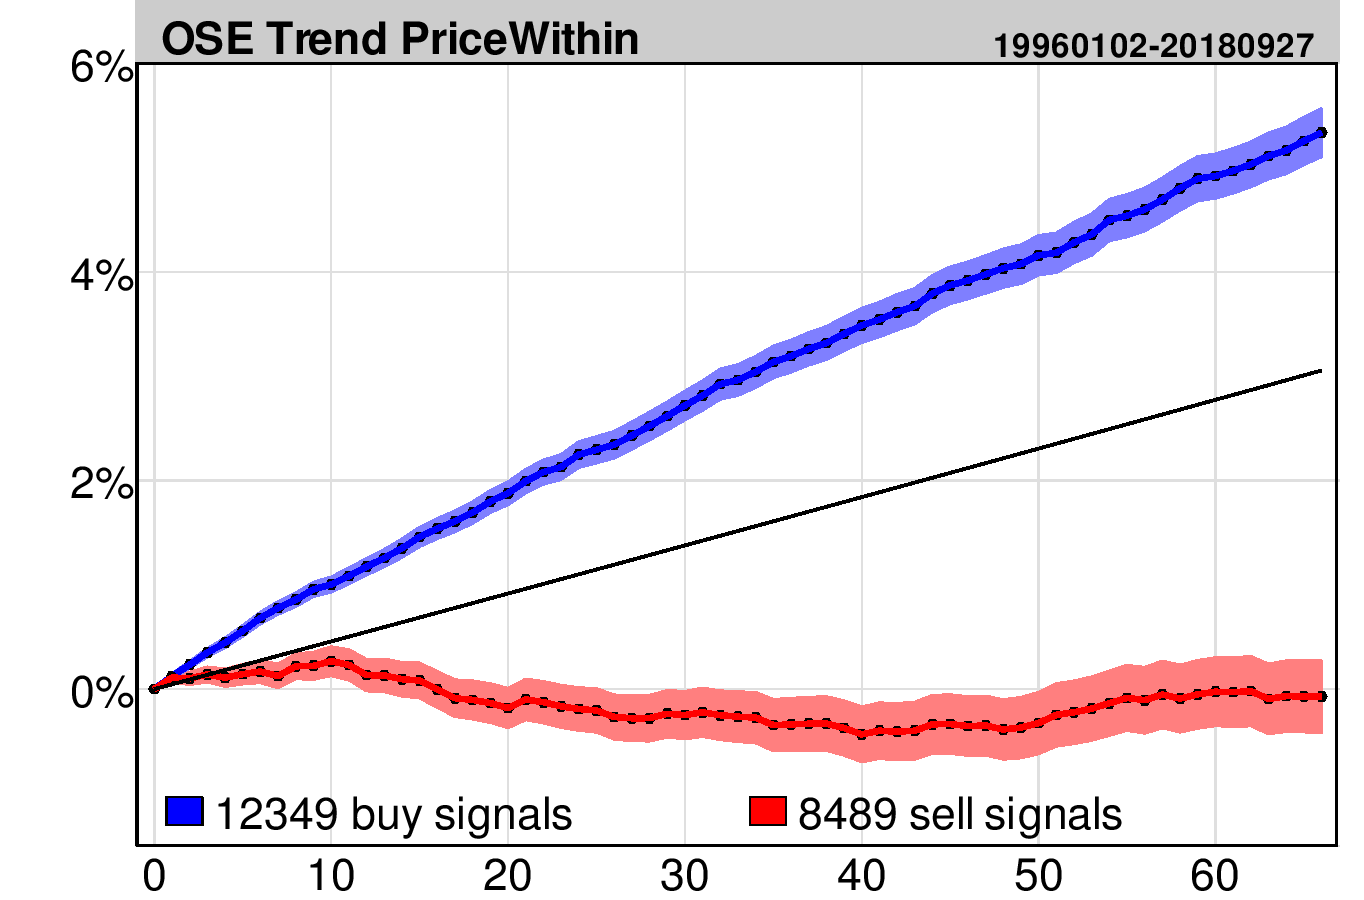
Trend Norway.
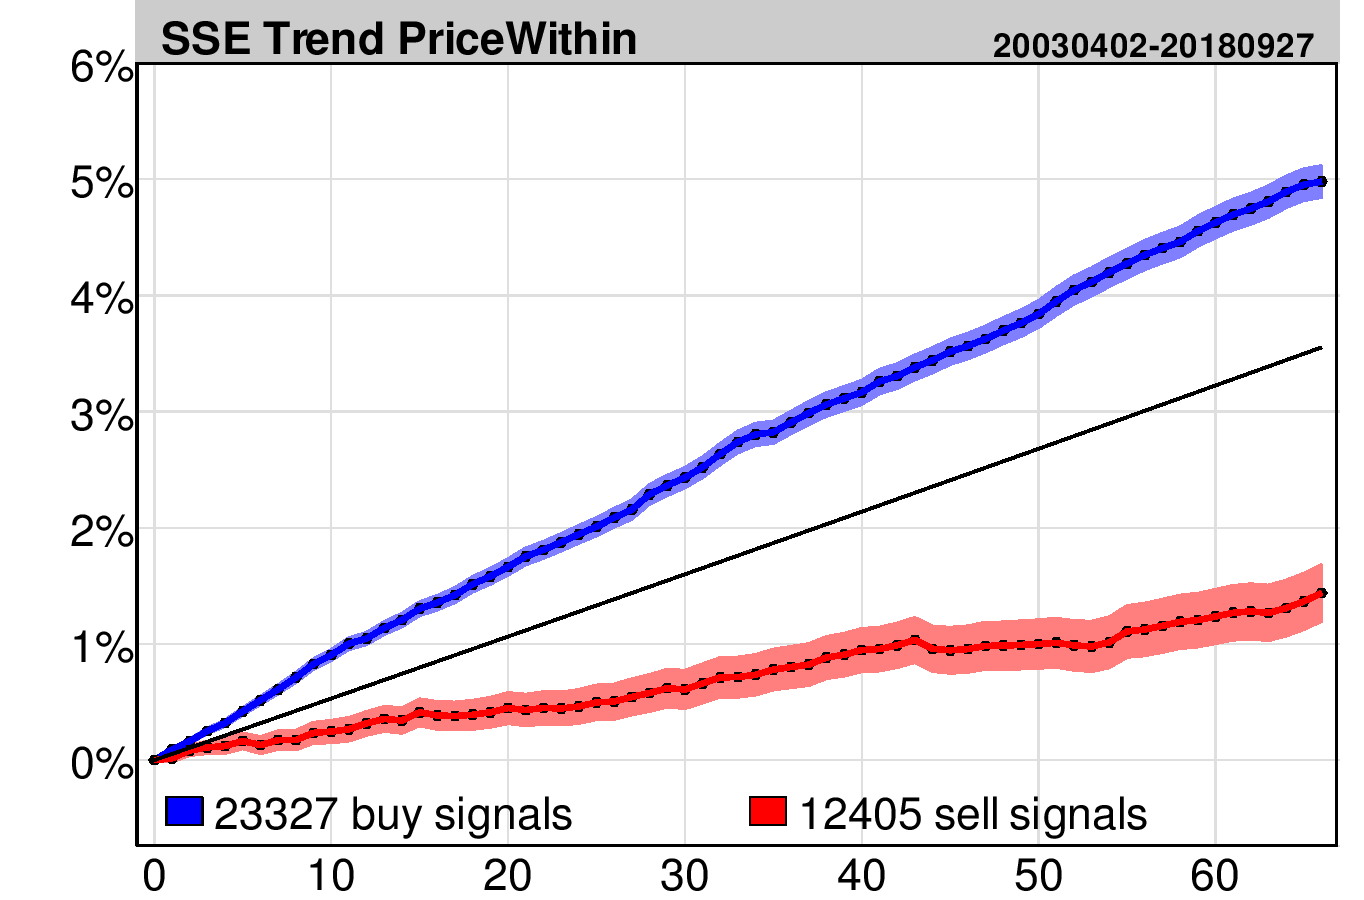
Trend Sweden.
Trend Denmark.
Trend Finland.
The charts show average price development following buy and sell signals from rising and falling trends respectively. Signals are triggered on day 0. Only days when the exchange is open are included, so 66 days equal approximately three months. Buy signals are the blue line and sell signals are the red one. The shaded areas are the standard deviation of the calculations. Benchmark index is the black line.
The results are very similar in all four markets. In all markets stocks in rising trends rise more than benchmark and stocks in falling trends underperform vs benchmark.
Please find more results and details in the research report here.
Keywords: Buy signal,falling trend,h_TR,Nordic markets,rising trend,Sell signal,statistics,trend signal.
Skrivet av

Analytiker
i Investtech
"Investtech analyserar psykologin i marknaden och ger dig konkreta tradingförslag varje dag."

Partner & Senior Advisor - Investtech


Investtech garanterar inte fullständigheten eller korrektheten av analyserna. Eventuell exponering utifrån de råd / signaler som framkommer i analyserna görs helt och fullt på den enskilda investerarens räkning och risk. Investtech är inte ansvarig för någon form för förlust, varken direkt eller indirekt, som uppstår som en följd av att ha använt Investtechs analyser. Upplysningar om eventuella intressekonflikter kommer alltid att framgå av investeringsrekommendationen. Ytterligare information om Investtechs analyser finns på infosidan.
Investtech garanterar inte fullständigheten eller korrektheten av analyserna. Eventuell exponering utifrån de råd / signaler som framkommer i analyserna görs helt och fullt på den enskilda investerarens räkning och risk. Investtech är inte ansvarig för någon form för förlust, varken direkt eller indirekt, som uppstår som en följd av att ha använt Investtechs analyser. Upplysningar om eventuella intressekonflikter kommer alltid att framgå av investeringsrekommendationen. Ytterligare information om Investtechs analyser finns på infosidan.
Copyright Ⓒ 1997-2024 Investtech.com AS, Org nr 978 655 424 MVA Integrationspolicy | Ansvarsfrånskrivelse
Huvudkontor
Strandveien 171366 Lysaker, Norway
Analysavdelning
Instituttveien 102007 Kjeller, Norway