
 Oslo Børs
 Stockholmsbörsen
 Københavns Fondsbørs
Investeringsforeninger
Københavns Fondsbørs
Investeringsforeninger
 Helsingin pörssi
 World Indices
 US Stocks
US 30
Nasdaq 100
US 500
US Stocks
US 30
Nasdaq 100
US 500
 Toronto Stock Exchange
 London Stock Exchange
 Euronext Amsterdam
 Euronext Brussel
 DAX
SDAX
TECDAX
Frankfurt
CDAX
MDAX
Prime Standard
DAX
SDAX
TECDAX
Frankfurt
CDAX
MDAX
Prime Standard
 CAC 40
 Mumbai S.E.
National S.E.
Mumbai S.E.
National S.E.
 Commodities
 Currency
 Cryptocurrency
 Exchange Traded Funds
 Investtech Indices
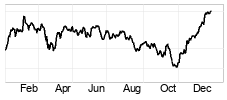
OMX Stockholm PI (OMXSPI.ST)
Cours de clôture: 951.83 (+14.76), 26. avr 2024
Complete report
Algorithmic Overall Analysis
Conclusion légèrement positive (Score: 42)
26. avr 2024. Updated daily.
Analyst's Recommendation
Conclusion légèrement positive
25. avr 2024. 2 jours depuis.
Analyses

Court

Moyen

Long
Général

Insider
Investor Psychology - Behavioural Finance - Quantitative Analysis - Scientific Methods
Technical Analysis - Insider Trades - Seasonal Variations - Intraday Trading
Stock data
| Price date | 26. avr 2024 |
| Currency | SEK |
| ISIN | SE0000744195 |
| Rise from year low | 26.35% |
| Fall from year high | -2.03% |
Automatic technical analysis. Court terme
Court terme
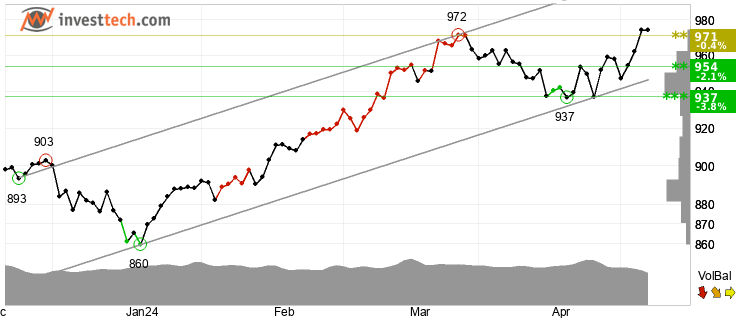
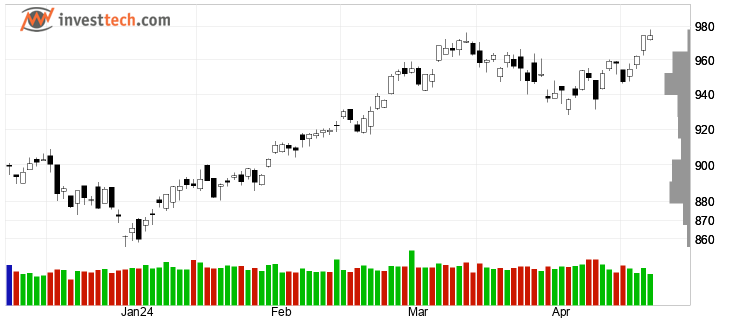
OMX Stockholm PI a débordé le canal baissier à la hausse, ce qui, dans un premier temps, indique un taux de repli moins fort. L'indice teste la résistance à environ 954 points, ce qui peut résulter en une correction. La courbe RSI montre une tendance haussière, ce qui pourrait être le signal précurseur d'une nouvelle tendance ascendante. L'indice est généralement considéré comme légèrement negatif technique pour court terme.Recommendation one to six weeks: Conclusion légèrement négative (Score: -35)
Automatic technical analysis. Moyen terme
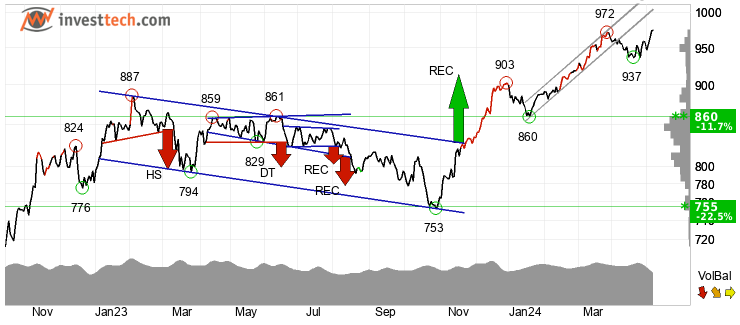
Moyen terme
OMX Stockholm PI a débordé du canal haussier à la baisse. Cela indique dans un premier temps, un taux de croissance plus faible ou le début d'un développement plus horizontal. La valeur a cru fortement après un signal d'achat d'une formation rectangulaire sur le franchissement de la résistance à 828 l'objectif de 914 est maintenant atteint, mais la formation indique une poursuite du développement dans la même direction. L'indice s'approche de la résistance à environ 970 points, ce qui peut indiquer qu'une correction est possible. L'indice est généralement considéré comme légèrement positif technique pour moyen long terme.Recommendation one to six months: Conclusion légèrement positive (Score: 38)
Automatic technical analysis. Long terme
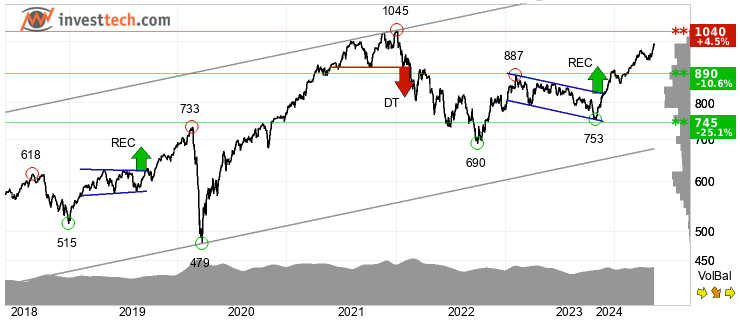
Long terme
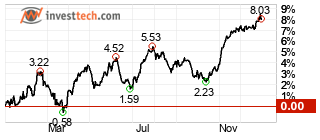
OMX Stockholm PI fluctue dans un canal haussier, qui indique une poursuite de la croissance. La valeur a cru fortement après un signal d'achat d'une formation rectangulaire sur le franchissement de la résistance à 828 l'objectif de 914 est maintenant atteint, mais la formation indique une poursuite du développement dans la même direction. L'indice rencontre du support à environ 890 points et de la résistance à environ 1040 points. L'indice est généralement considéré comme positif technique pour long terme.Recommendation one to six quarters: Positif (Score: 73)
Max
Candlesticks 95 days
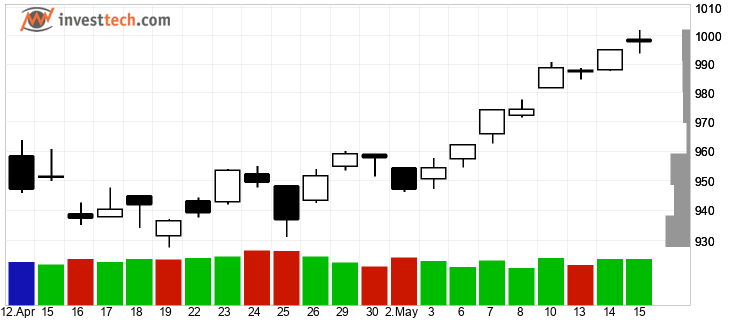
Candlesticks 22 days
Transactions Inside
Insider trades reported last 18 months. The stock is neutral on Insider Trades.
| List date | Trade date | Nombre | Cours | Valeur de marché | Texte | Importance |
|---|
Commentaires
Automatic technical analysis of the stock, based on last closing price. The chart may have changed since the analyst's recommendation was written.
Analyst's Recommendation
25. avr 2024 (2 jours depuis)Lars-Göran Westerberg
lars.goran.westerberg@investtech.com
Recommendation one to six months: Conclusion légèrement positive
Lars-Göran Westerberg, 25. avr 2024 (cours 937.06)
Stockholmsbörsens breda OMXSPI-index stängde ned 1,3 procent under torsdagen till en notering på 937 punkter. Den tekniska bilden är fortsatt i huvudsak positiv med en brant stigande trend identifierad i grafen på medellång sikt. Indexet har dock brutit ned genom golvet i trendkanalen, vilket i första skedet indikerar en svagare stigningstakt, eller inledningen av en mer horisontell utveckling. Närmaste stödnivå återfinns runt 900 punkter i grafen på kort sikt, därunder vid 860 punkter. Motstånd har identifierats vid 970 punkter och vi behöver se brott genom denna nivå för köpsignal.Investtechs korta Hausseindex står idag i 48 på kort sikt. Indexet går mellan 0 och 100 och är en optimistindikator som visar andelen aktier på Stockholmsbörsen som haft köpsignal som sista signal. Ett värde mellan cirka 45-55 indikerar jämvikt mellan pessimister och optimister. På lång sikt står indexet i 52. Vi har därmed i stort sett jämvikt mellan optimister och pessimister på börsen.
Investtechs insiderbarometer visar antalet köp- och säljtransaktioner som har genomförts av insynspersoner i börsens bolag. Den senaste månaden har det registrerats 294 köp och 86 försäljningar, vilket motsvarar en köpandel på 77 procent. Köpandelen på årsbasis är 83 procent. Vi befinner oss i rapportsäsongen för första kvartalet 2024. Detta gör att aktiviteten bland börsens insynspersoner är begränsad. Investtechs forskning visar att aktier starka på insiderhandel statistiskt överpresterar mot marknaden.
OMXSPI är samlat sett tekniskt svagt positiv på medellång sikt (1-6 månader). Vi rekommenderar långsiktiga investerare att alltid vara investerade på marknaden.
Recommendation one to six months: Conclusion légèrement positive
Published: Rapport du jour (25. avr 2024 22:04) [LGW]
The analysis is written by Investtech's analyst on the given date based on the price charts of this date. The analysis is meant to be valid for a few weeks, up to a few months. Later price developments may indicate changes in the market and investor optimism, and render the analysis outdated. Investtech's automatic analyses, updated daily, will often reflect such changes.
Previous recommendations
Lars-Göran Westerberg, 12. avr 2024 (cours 947.71)
Under torsdagen utvecklades Stockholmsbörsens breda OMXSPI-index negativt (-0,8 procent) och stängde på 948 punkter. Den tekniska bilden är fortsatt positiv med en brant stigande trend identifierad i grafen på medellång sikt. Kursen har dock brutit ned genom golvet i trendkanalen, vilket i första skedet indikerar en svagare stigningstakt, eller inledningen av en mer horisontell utveckling. Närmaste stödnivå återfinns runt 900 punkter i grafen på kort sikt, därunder vid 860 punkter. Motstånd har identifierats vid 970 punkter och vi behöver se brott genom denna nivå för köpsignal.
Investtechs korta Hausseindex står idag i 59 på kort sikt. Indexet går mellan 0 och 100 och är en optimistindikator som visar andelen aktier på Stockholmsbörsen som haft köpsignal som sista signal. Ett värde mellan cirka 45-55 indikerar jämvikt mellan pessimister och optimister. På lång sikt står indexet i 56. Vi har därmed i stort sett jämvikt mellan optimister och pessimister på börsen.
Investtechs insiderbarometer visar antalet köp- och säljtransaktioner som har genomförts av insynspersoner i börsens bolag. Den senaste månaden har det registrerats 382 köp och 134 försäljningar, vilket motsvarar en köpandel på 74 procent. Köpandelen på årsbasis är 83 procent. Investtechs forskning visar att aktier starka på insiderhandel statistiskt överpresterar mot marknaden.
OMXSPI är samlat sett tekniskt svagt positiv på medellång sikt (1-6 månader). Vi rekommenderar långsiktiga investerare att alltid vara investerade på marknaden.
Published: Rapport du jour (12. avr 2024 00:41) [LGW]
David Östblad, 13. fév 2024 (cours 897.93)
Marknaden öppnade veckan med en uppgång på 0.81 procent och stängde på 898 punkter under måndagen. Indexet har inte varit högre sedan 2 januari i år. Indexet har nu stigit 12 av de senaste 16 dagarna. En positiv signal är att kursen har brutit upp genom motståndet vid 888-punktersnivån som därmed har ombildats till en ny stödnivå. Ett nytt brott genom 903 punkter skulle utlösa ännu en köpsignal.
Investtechs korta Hausseindex står idag i 42 på kort sikt. Indexet går mellan 0 och 100 och är en optimistindikator som visar andelen aktier på Stockholmsbörsen som haft köpsignal som sista signal. Ett värde mellan cirka 45-55 indikerar jämvikt mellan pessimister och optimister. På lång sikt står indexet i 55. Vi har därmed i stort sett jämvikt mellan optimister och pessimister på börsen på både kort- och lång sikt.
Investtechs insiderbarometer visar antalet köp- och säljtransaktioner som har genomförts av insynspersoner i börsens bolag. Den senaste månaden har det registrerats 240 köp och 86 försäljningar, vilket motsvarar en köpandel på 74 procent. Köpandelen på årsbasis är 83 procent. Vi befinner oss i rapportsäsongen vilket gör att antalet insideraffärer är relativt få. Detta då många personer med insyn i bolagen inte är tillåtna handla aktier i det egna bolaget i anslutning till offentliggörandet av resultatrapporten. Investtechs forskning visar att aktier starka på insiderhandel statistiskt överpresterar mot marknaden.
OMXSPI är samlat sett tekniskt positiv på medellång sikt (1-6 månader). Närheten till stöd- och motståndsnivåer gör att den tekniska bilden, och med det rekommendationen för indexet, snabbt kan ändras. Vi rekommenderar långsiktiga investerare att alltid vara investerade på marknaden.
Published: Rapport du jour (13. fév 2024 08:09) [DO]
Analysts' recommendations last 18 months
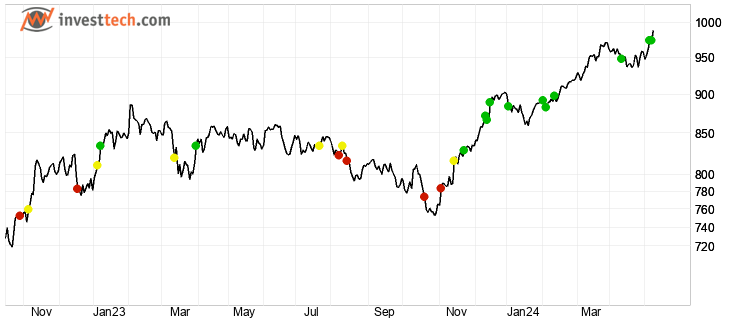
Positif/Conclusion légèrement positive
A surveiller
Négatif/Conclusion légèrement négative
History of Investtech's analysts' analyses of the stock. Analyses are shown by coloured dots on the day the analysis was based on.
| Évaluation | Horizon de temps | Cours | Published | Analyst |
|---|---|---|---|---|
 Conclusion légèrement positive Conclusion légèrement positive | Moyen terme | 937.06 | 25. avr 2024 22:04, Rapport du jour | LGW |
| Conclusion légèrement positive | Moyen terme | 947.71 | 12. avr 2024 00:41, Rapport du jour | LGW |
 Positif Positif | Moyen terme | 897.93 | 13. fév 2024 08:09, Rapport du jour | DO |
| Conclusion légèrement positive | Moyen terme | 882.38 | 6. fév 2024 07:36, Rapport du jour | DO |
| Positif | Moyen terme | 892.01 | 2. fév 2024 08:46, Rapport du jour | LGW |
| Conclusion légèrement positive | Moyen terme | 884.03 | 4. jan 2024 08:25, Rapport du jour | LGW |
| Positif | Moyen terme | 889.11 | 15. dec 2023 00:30, Rapport du jour | LGW |
| Conclusion légèrement positive | Moyen terme | 866.84 | 13. dec 2023 08:57, Rapport du jour | LGW |
| Positif | Moyen terme | 871.53 | 12. dec 2023 08:27, Rapport du jour | DO |
| Conclusion légèrement positive | Moyen terme | 828.70 | 23. nov 2023 00:27, Rapport du jour | LGW |
 A surveiller A surveiller | Moyen terme | 815.85 | 15. nov 2023 08:55, Rapport du jour | LGW |
 Conclusion légèrement négative Conclusion légèrement négative | Moyen terme | 783.58 | 3. nov 2023 08:53, Rapport du jour | LGW |
 Négatif Négatif | Moyen terme | 773.50 | 20. oct 2023 08:40, Rapport du jour | LGW |
| Conclusion légèrement négative | Moyen terme | 815.90 | 16. aoû 2023 07:42, Rapport du jour | DO |
| A surveiller | Moyen terme | 834.23 | 10. aoû 2023 22:41, Rapport du jour | DO |
| Conclusion légèrement négative | Moyen terme | 822.16 | 9. aoû 2023 07:23, Rapport du jour | DO |
| A surveiller | Moyen terme | 834.02 | 24. jul 2023 00:34, Rapport du jour | LGW |
| Conclusion légèrement positive | Moyen terme | 833.78 | 31. mar 2023 08:45, Rapport du jour | LGW |
| A surveiller | Moyen terme | 819.33 | 14. mar 2023 08:23, Rapport du jour | DO |
| Conclusion légèrement positive | Moyen terme | 833.88 | 10. jan 2023 08:17, Rapport du jour | DO |
| A surveiller | Moyen terme | 810.32 | 5. jan 2023 02:51, Rapport du jour | LGW |
| Conclusion légèrement négative | Moyen terme | 783.11 | 18. dec 2022 22:29, Rapport du jour | LGW |
| A surveiller | Moyen terme | 759.49 | 6. nov 2022 20:50, Rapport du jour | LGW |
| Conclusion légèrement négative | Moyen terme | 749.91 | 26. oct 2022 08:33, Rapport du jour | DO |
| Négatif | Moyen terme | 725.89 | 20. oct 2022 08:03, Rapport du jour | DO |
| A surveiller | Moyen terme | 739.89 | 19. oct 2022 08:52, Rapport du jour | LGW |
| Négatif | Moyen terme | 712.85 | 16. oct 2022 21:14, Rapport du jour | LGW |
DO: David Östblad (Analytiker)
LGW: Lars-Göran Westerberg (Analytiker)
Seasonal variations
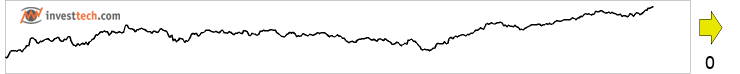
Seasonal prediction from today's date
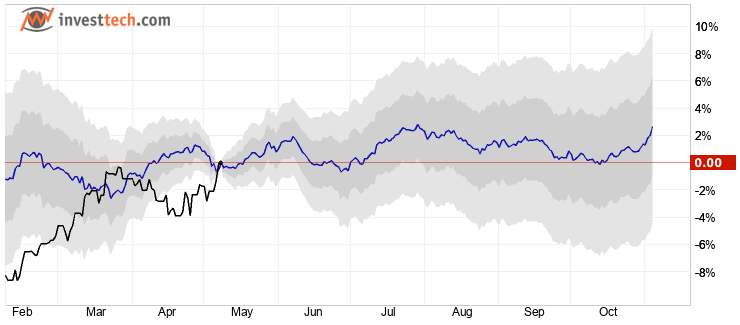
The blue line shows average price development the past 10 years, in the period from three months before to six months after today's date. The black line is actual price development in the past three months. Shaded areas are one and two standard deviations.
Monthly and annual statistics
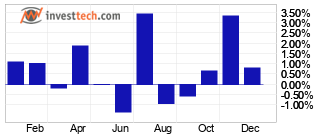
Average development per month, last 10 years
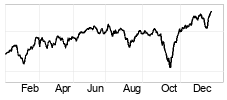
Average development throughout the year, last 10 years
Annual development from 2014 to 2023
2014
2015
2016
2017
2018
2019
2020
2021
2022
2023
Signal précurs.
| Cours de clôture, qui en cas de franchissement, déclenche des nouveaux signaux |  | |
|---|---|---|
| Indicateur | Cours | Objectif |
| RSI élevé | 1 067.23 | - |
| Last close | 951.83 | - |
| Trading Range court terme | 936.74 | - |
| Trading Range long terme | 936.74 | - |
| RSI bas | 900.97 | - |
| Indicateur: | Type d'indicateur ayant déclenché le signal | |
| Cours: | Si le cours de clôture franchit ce niveau, un nouveaux signal technique sera déclenché. | |
| Objectif: | Objectif du cours selon le signal donné (Seulement ceux donnés par des formations graphiques | |
Alertes
Aucune alerteKey ratios
Data missingHelp and information - Research shows the importance of Trend, Momentum and Volume
Investtechs analyses focus on a stocks trend status, short term momentum and volume development. These are central topics of technical analysis theory that describe changes in investor optimism or fluctuations in a companys financial development. However, Investtechs strong focus on these elements is due to research results that clearly indicate causation between these factors and future return on the stock market.
Trend

Theory: Stocks in rising trends will continue to rise.
Psychology/economy: Rising trends indicate that the company experiences positive development and increasing buy interest among investors. Read more
Research: Stocks in rising trend channels in Investtechs medium long term charts have been followed by an annualized excess return of 7.8 percentage points compared to average benchmark development. This is shown by Investtechs research into 34,880 cases of stocks in rising trends on the Nordic Stock Exchanges in the period 1996 to 2015.
Read more about the research results here
Momentum

Theory: Stocks with rising short term momentum will continue to rise. Stocks with very strong momentum (overbought) will react backwards.
Psychology/economy: RSI above 70 shows strong positive momentum. The stock has risen in the short term without any significant reactions downwards. Investors have kept paying more to buy stocks. This indicates that more investors want to buy the stock and that the price will continue to rise. Read more
Research: Stocks with strong momentum have on average continued to rise, and more so than the average stock listed on the Exchange. This is shown by Investtechs research into 24,208 cases of stocks on the Nordic Stock Exchanges in the period 1996 to 2015 where RSI went above 70 points, indicating strong and increasing short term momentum. On average, annualized, the stocks rose the equivalent of 11.4 percentage points more than the average stock.
Read the research report here
Volume

Theory: Rising prices on high volume and falling prices on low volume indicate strength in a stock. Volume can confirm a rising trend or signal that a falling trend is ending.
Psychology/economy: When investors very much want to buy a stock, they have to increase the price to find new sellers. Rising price on high volume shows that some investors are so aggressive that they push the price up to be able to buy the stock. Investtechs Volume Balance tool measures the relation between price rise and volume and measures investor aggression at rising and falling prices. Read more
Research: Stocks with volume balance above 40 have been followed by an average annual return of 4.7 percentage points on the Nordic Stock Exchanges, shown by research conducted by Investtech into 24,580 cases.
Read the research report here
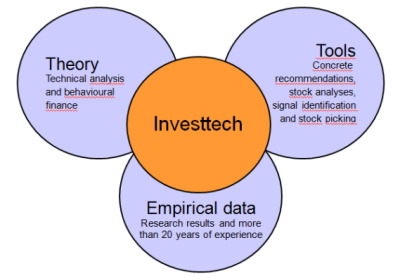
Investtech's analyses
Investtech has combined theory, psychology and research into powerful investment tools.
About Investtech
Investtech are behavioural finance and quantitative stock analysis specialists. The company sells analysis products to private, professional and institutional investors. Investtech manage the AIFM company Investtech Invest, which invests customers funds in the stock market.
Investtechs computers analyze more than 28,000 stocks from 12 different countries every day. The analyses are presented in eight languages and sold to customers worldwide. In addition to the automatic analyses, the companys analysts present subjective assessments and recommendations for some markets. The analyses are available to customers in the form of daily morning reports and cases, and weekly market updates and model portfolios.
Investtechs algorithms for analysis, ranking and stock recommendations are based on research dating back to 1993. Part of the research was conducted in cooperation with Oslo University and the Norwegian Research Council. Research still has high priority for Investtech. Many of the companys research results are available for customers on the companys web site.
The companys basic product starts at approx. 30 euro per month. Investtech also provides bespoke products for integration on partners web sites and for use in newsletters, for example to stock brokers and the media. Contact us by e-mail to info@investtech.com or by phone +47 21 555 888 for more information. A free trial subscription is available to order on our web site www.investtech.com.

Head Office
Investtech ASStrandveien 17
1366 Lysaker
adr.officeAddress04
+47 21 555 888
Postal address
Investtech ASStrandveien 17
1366 Lysaker
adr.postAddress04
info@investtech.com
VAT no. 978 655 424 MVA
Research Department
Instituttveien 102007 Kjeller
adr.researchAddress03
adr.researchAddress04
www.investtech.com
Investor Psychology - Behavioural Finance - Quantitative Analysis - Scientific Methods
Technical Analysis - Insider Trades - Seasonal Variations - Intraday Trading
Investtech guarantees neither the entirety nor accuracy of the analyses. Any consequent exposure related to the advice / signals which emerge in the analyses is completely and entirely at the investors own expense and risk. Investtech is not responsible for any loss, either directly or indirectly, which arises as a result of the use of Investtechs analyses. Details of any arising conflicts of interest will always appear in the investment recommendations. Further information about Investtechs analyses can be found here disclaimer.
The content provided by Investtech.com is NOT SEC or FSA regulated and is therefore not intended for US or UK consumers.
Copyright Ⓒ 1997-2024 Investtech.com AS, Org nr 978 655 424 MVA Privacy Policy | Conditions générales d'utilisation et avis de précaution
Head office
Strandveien 171366 Lysaker, Norway
Research department
Instituttveien 102007 Kjeller, Norway
×
