
 Oslo Børs
 Stockholmsbörsen
 Københavns Fondsbørs
Investeringsforeninger
Københavns Fondsbørs
Investeringsforeninger
 Helsingin pörssi
 World Indices
 US Stocks
US 30
Nasdaq 100
US 500
US Stocks
US 30
Nasdaq 100
US 500
 Toronto Stock Exchange
 London Stock Exchange
 Euronext Amsterdam
 Euronext Brussel
 DAX
SDAX
TECDAX
Frankfurt
CDAX
MDAX
Prime Standard
DAX
SDAX
TECDAX
Frankfurt
CDAX
MDAX
Prime Standard
 CAC 40
 Mumbai S.E.
National S.E.
Mumbai S.E.
National S.E.
 Commodities
 Currency
 Cryptocurrency
 Exchange Traded Funds
 Investtech Indices
Today's free analyses
S&P BSE SENSEX (999901)
Close: 73730.0000 (-609.2800), 26 Apr 2024
Positive
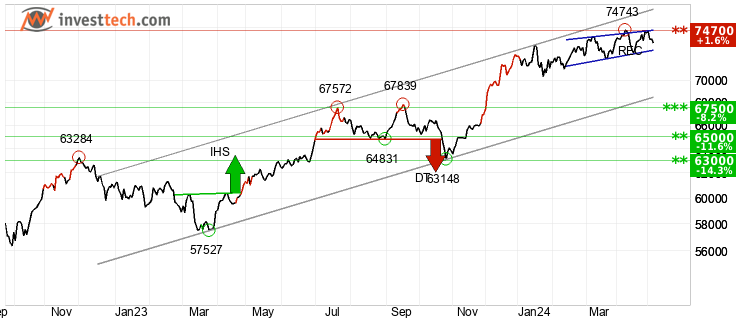
S&P BSE SENSEX shows strong development within a rising trend channel in the medium long term. Rising trends indicate that the market experiences positive development and that buy interest among investors is increasing. The index is moving within a rectangle formation between support at 72657 and resistance at 75103. A decisive break through one of these levels indicates the new direction for the index. There is no resistance in the price chart and further rise is indicated. In case of a negative reaction, the index has support at approximately 72200 points. The index is overall assessed as technically positive for the medium long term.
Infosys Ltd (500209)
Close: 1430.1500 (-8.2500), 26 Apr 2024
Neutral

Infosys Ltd has broken through the floor of a rising trend channel in the medium long term. This indicates a slower rising rate at first, or the start of a more horizontal development. The stock has support at rupee 1350 and resistance at rupee 1510. The short term momentum of the stock is strongly negative, with RSI below 30. This indicates increasing pessimism among investors and further decline for Infosys Ltd. However, particularly in big stocks, low RSI may be a sign that the stock is oversold and that there is a chance for a reaction upwards. The stock is overall assessed as technically neutral for the medium long term.
Partners


Technical analysis webinar with Investtech
Currently no scheduled webinars.| Date | Time | Title | |
|---|---|---|---|
| December 4, 2023 | 17.00 - 17.35 CET | Get started with Investtech | |
| March 2, 2022 | 19.30 - 20.15 CET | Get started with Investtech | |
| May 18, 2021 | 18.00 - 19.15 CEST | Introduction to investing and stock analysis. | |
| September 24, 2020 | 19.00 - 19.45 CEST | Introduction to Investtech by Country Manager Jan Marius van Leeuwen. | |
| August 27, 2020 | 19.00 - 19.45 CEST | Introduction to Investtech by Country Manager Jan Marius van Leeuwen. | |
| May 26, 2020 | 19.00 - 19.45 CEST | Introduction to Investtech by Country Manager Jan Marius van Leeuwen. | |
| June 26, 2019 | 10.00 - 10.30 CEST | Volume - Reality check!by Analyst Kiran Shroff. | |
| May 7, 2019 | 10.00 - 10.30 CEST | Trend is your best friend by Analyst Kiran Shroff. | |
| Dec 13, 2018 | 15.00 - 15.40 CET | Introduction to Investtech by Sales Manager Jan Marius van Leeuwen and Analyst Kiran Shroff. | |
| Nov 28, 2018 | 15.00 - 15.40 CET | Introduction to Investtech by Sales Manager Jan Marius van Leeuwen and Analyst Kiran Shroff. | |
| Nov 14, 2018 | 15.00 - 15.40 CET | Introduction to Investtech by Sales Manager Jan Marius van Leeuwen and Analyst Kiran Shroff. | |
| Oct 31, 2018 | 09.00 - 09.40 CET | Introduction to Investtech by Sales Manager Jan Marius van Leeuwen and Analyst Kiran Shroff. |
Upcoming events
Currently no scheduled events.Previously:
| Date | Location | Title | |
|---|---|---|---|
| November 22, 2023, time: 16.00 - 21.00 | Stockholm, Sweden | IG's Trading Seminar 2023 | |
| November 8, 2023, time: 17.00 - 19.30 | Oslo, Norway | Seminar: Investment Climate Opportunities and Challenges autumn 2023 | |
| September 27, 2023, 17.00 - 19.30 | Bergen, Norway | Seminar: Investment Climate Opportunities and Challenges autumn 2023 | |
| November 16, 2022, 17.00 - 19.30 | Oslo, Norway | Seminar: Investment Climate Opportunities and Challenges autumn 2022 | |
| September 29, 2022, 17.30 - 19.30 | Stavanger, Norway | Seminar with Investtech and CMC Markets |
How Investtech works

Collect stock market data
Price, volume, insider information, corporate actions etc.

Perform advanced analysis
Using mathematical pattern recognition, statistical optimization and behavioural finance

Deliver actionable insights
Daily across the stocks, indices and commodities that matter most to your portfolio
Pricing
Investor
Everything you need to start planning your investment decisions.
€
14
€
14
/ month
Billed Monthly
Order- Analysis of stocks listed at National and Mumbai Stock Exchanges
- Medium and long term charts ⓘAnalyses for the medium and long term, respectively 1-6 months and 1-6 quarters investment perspective.
Medium and long term charts → - Concrete buy and sell signals ⓘSpecific buy and sell signals for each stock.
- Health Check ⓘGet a detailed portfolio health check.
- Today's Case ⓘToday's Case gives you a selected stock which is technically positive.
- Top 50 ⓘThe Top50 list provides you with a ranking of the 50 most positive/negative stocks.
Top 50 → - Price alerts ⓘYou may enter a price alert for a stock and be notified when the price reaches this level.
Price alerts →
Most Popular
Trader
Take your investment decisions to another level with short term analyses and more advanced tools.
€
29
€
29
/ month
Billed Monthly
Order- All Investor features
- +
- Short term charts and analyses ⓘAnalyses for the short term, 1-6 weeks investment perspective.
Short term charts and analyses → - Morning reports ⓘThe report consists of daily evaluations by Investtech`s automated analysis system.
- Trend signals ⓘThe Trend signals tool shows stocks that recently entered into a rising or falling trend.
Trend signals → - Pivot points ⓘPivot points are tops and bottoms in the chart.
Pivot points → - Key ratios ⓘKey financial indicators give information about a company's performance based on reported financial results for a given time period.
Key ratios → - Candlesticks ⓘCandlestick analysis is the best tool for doing a detailed short term volume analysis.
Candlesticks →
Professional
A wide range of advanced selection tools and overall analysis to scale your investments.
€
58
€
58
/ month
Billed Monthly
Order- All Trader features
- +
- Overall analysis ⓘOverall analysis for all time perspectives; long, medium and short term.
Overall analysis → - Stock selection ⓘStock selection is likely the best stock picking tool Investtech offers. The most common usage is to select liquidity and time perspective, e.g. 50 % most liquid and short term.
Stock selection → - Hausse ⓘThe Hausse indices are indicators of optimism.
Hausse → - Result Analysis ⓘHow the stock price has moved before and after the company's publication of accounting figures.
Result Analysis → - Compare stocks ⓘCompare the price development of a stock with 30,000 other stocks, commodities and indices.
Compare stocks → - Trading opportunities ⓘThe Trading opportunities table is a stock picking tool. The table shows stocks with combinations of technical indicators that strongly indicate further rise or fall.
Trading opportunities → - Seasonal variations ⓘAnalysis of seasonal variations shows how a stock statistically has varied throughout the year.
Seasonal variations → - Ranking by signals ⓘAn overview of the latest buy and sell signals identified by Investtech`s systems. Signals from price patterns are assumed to indicate in which direction the majority of investors are moving.
Ranking by signals →
Institutional
Access to all 30,000 stocks, commodities and currencies, suited for experienced investment strategists.
Get in touch
Contact us - All Professional features
- +
- All 30,000 stocks, commodities and currencies ⓘAll 30,000 stocks, commodities and currencies.
- Self-defined universes ⓘDefine your own universe of stocks.
- Alarms ⓘOverview of the stocks in your universes that have triggered signals.
- Flexible selection criteria ⓘWide range of flexible selection criteria.
About Us
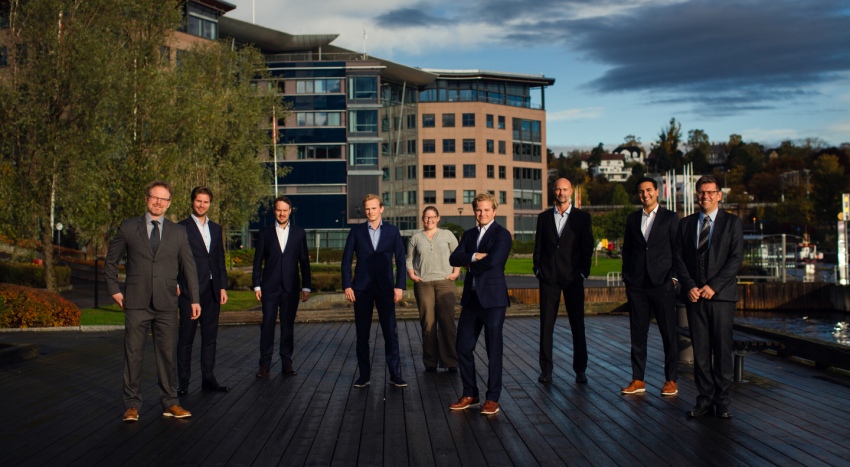
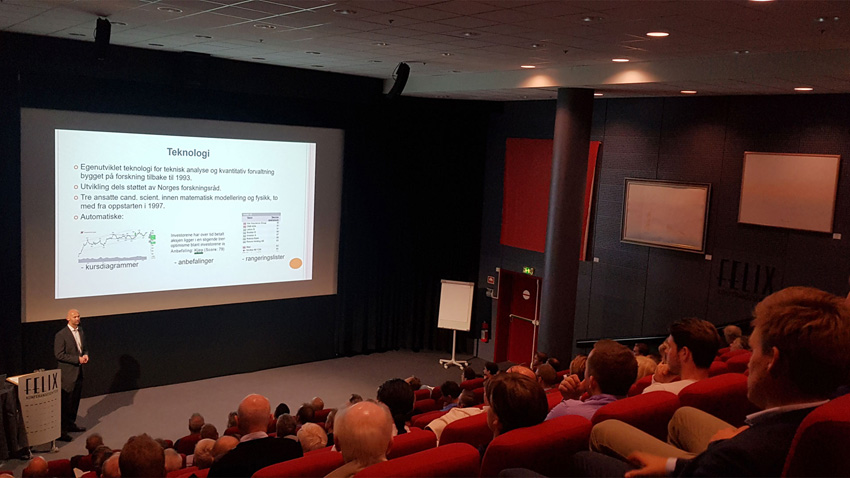
Founded in 1997, Investtech is a leading Scandinavian company within the field of research on behavioral finance and technical analysis of stocks. Investtechs research findings have been put into practice and have resulted in a comprehensive decision support system analyzing stocks and other securities. The system is utilized daily by investors worldwide.
Investtech uses advanced mathematical models and statistical optimization techniques as a basis for the analyses, generating objective and transparent decision support. The company provides web-based subscriptions to private investors and has been a prominent provider of technical analyses to financial institutions, brokerages and media since 1999. Courses, seminars and webinars are also arranged with clients directly, or in collaboration with partners.

Head office
Strandveien 171366 Lysaker, Norway
Research department
Instituttveien 102007 Kjeller, Norway
×
