
 Oslo Børs
 Stockholmsbörsen
 Københavns Fondsbørs
Investeringsforeninger
Københavns Fondsbørs
Investeringsforeninger
 Helsingin pörssi
 World Indices
 US Stocks
US 30
Nasdaq 100
US 500
US Stocks
US 30
Nasdaq 100
US 500
 Toronto Stock Exchange
 London Stock Exchange
 Euronext Amsterdam
 Euronext Brussel
 DAX
SDAX
TECDAX
Frankfurt
CDAX
MDAX
Prime Standard
DAX
SDAX
TECDAX
Frankfurt
CDAX
MDAX
Prime Standard
 CAC 40
 Mumbai S.E.
National S.E.
Mumbai S.E.
National S.E.
 Commodities
 Currency
 Cryptocurrency
 Exchange Traded Funds
 Investtech Indices
Bayer AG (BAYN.DAX30)
Close: 26.90 (-0.07), Apr 25, 2024
See Recommendation
Automatic technical analysis. Medium term, Apr 25, 2024
Bayer AG has broken through the ceiling of a falling trend channel in the medium long term. This indicates a slower falling rate initially, or the start of a more horizontal development. An inverse head and shoulders formation is under development. A decisive break of the resistance at 28.52, ideally with an increase in volume, signals a further rise. There is no support in the price chart and further decline is indicated. In case of a positive reaction, the stock has resistance at 30.00 Euro. RSI diverges positively against the price, which indicates a possibility for a reaction up.Recommendation one to six months: See Recommendation
Partners


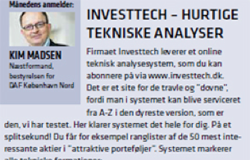
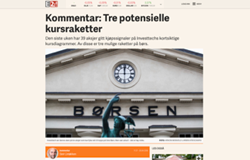
Investtech in the media
Digital Investor

Dagbladet
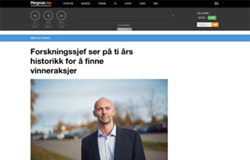
Hegnar
E24
Placera
How Investtech works

Collect stock market data
Price, volume, insider information, corporate actions etc.

Perform advanced analysis
Using mathematical pattern recognition, statistical optimization and behavioural finance

Deliver actionable insights
Daily across the stocks, indices and commodities that matter most to your portfolio
Investtech by the numbers
Experience
26years
since 1997
Model portfolio
14.5%
average annual return
Analysis across
20+
stock exchanges
Recommendations of
30 000+
stocks, indices, currencies, cryptocurrencies and commodities
Pricing
Investor
Everything you need to start planning your investment decisions.
€
27
€
16
/ month
Billed Annually: € 199
Order- Analysis of stocks listed at Frankfurt und Xetra
- Medium and long term charts ⓘAnalyses for the medium and long term, respectively 1-6 months and 1-6 quarters investment perspective.
Medium and long term charts → - Concrete buy and sell signals ⓘSpecific buy and sell signals for each stock.
- Health Check ⓘGet a detailed portfolio health check.
- Today's Case ⓘToday's Case gives you a selected stock which is technically positive.
- Top 50 ⓘThe Top50 list provides you with a ranking of the 50 most positive/negative stocks.
Top 50 → - Price alerts ⓘYou may enter a price alert for a stock and be notified when the price reaches this level.
Price alerts → - Watchlist ⓘCreate a watchlist of stocks you are interested in.
- My portfolios ⓘGain better control of your investments with Investtech`s portfolio system.
My portfolios →
Most Popular
Trader
Take your investment decisions to another level with short term analyses and more advanced tools.
€
59
€
35
/ month
Billed Annually: € 429
Order- All Investor features
- +
- Short term charts and analyses ⓘAnalyses for the short term, 1-6 weeks investment perspective.
Short term charts and analyses → - Morning reports ⓘThe report consists of daily evaluations by Investtech`s automated analysis system.
- Trend signals ⓘThe Trend signals tool shows stocks that recently entered into a rising or falling trend.
Trend signals → - Pivot points ⓘPivot points are tops and bottoms in the chart.
Pivot points → - Key ratios ⓘKey financial indicators give information about a company's performance based on reported financial results for a given time period.
Key ratios → - Candlesticks ⓘCandlestick analysis is the best tool for doing a detailed short term volume analysis.
Candlesticks →
Professional
A wide range of advanced selection tools and overall analysis to scale your investments.
€
159
€
93
/ month
Billed Annually: € 1119
Order- All Trader features
- +
- Overall analysis ⓘOverall analysis for all time perspectives; long, medium and short term.
Overall analysis → - Stock selection ⓘStock selection is likely the best stock picking tool Investtech offers. The most common usage is to select liquidity and time perspective, e.g. 50 % most liquid and short term.
Stock selection → - Hausse ⓘThe Hausse indices are indicators of optimism.
Hausse → - Result Analysis ⓘHow the stock price has moved before and after the company's publication of accounting figures.
Result Analysis → - Compare stocks ⓘCompare the price development of a stock with 30,000 other stocks, commodities and indices.
Compare stocks → - Trading opportunities ⓘThe Trading opportunities table is a stock picking tool. The table shows stocks with combinations of technical indicators that strongly indicate further rise or fall.
Trading opportunities → - Ranking by signals ⓘAn overview of the latest buy and sell signals identified by Investtech`s systems. Signals from price patterns are assumed to indicate in which direction the majority of investors are moving.
Ranking by signals →
Institutional
Access to all 30,000 stocks, commodities and currencies, suited for experienced investment strategists.
Get in touch
Contact us - All Professional features
- +
- All 30,000 stocks, commodities and currencies ⓘAll 30,000 stocks, commodities and currencies.
- Self-defined universes ⓘDefine your own universe of stocks.
- Alarms ⓘOverview of the stocks in your universes that have triggered signals.
- Personal customer service representative for technical questions ⓘContact your personal customer service representative with any technical questions you may have.
- Flexible selection criteria ⓘWide range of flexible selection criteria.
Investtech guarantees neither the entirety nor accuracy of the analyses. Any consequent exposure related to the advice / signals which emerge in the analyses is completely and entirely at the investors own expense and risk. Investtech is not responsible for any loss, either directly or indirectly, which arises as a result of the use of Investtechs analyses. Details of any arising conflicts of interest will always appear in the investment recommendations. Further information about Investtechs analyses can be found here disclaimer.
The content provided by Investtech.com is NOT SEC or FSA regulated and is therefore not intended for US or UK consumers.
Head office
Strandveien 171366 Lysaker, Norway
Research department
Instituttveien 102007 Kjeller, Norway
×
